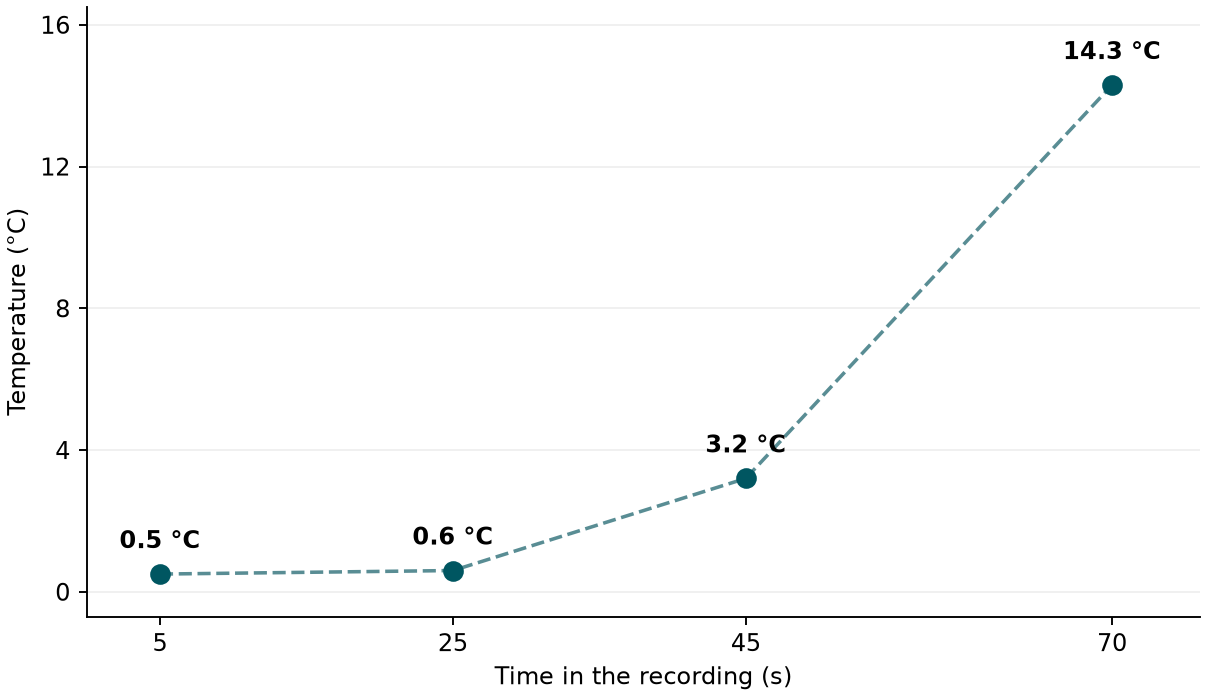
A heating curve shows how the temperature of a substance changes as it takes in energy. Here we read one from four values taken by hand from four frames of a single synchronized, low-heat lab recording: 0.5 °C at second 5, 0.6 °C at second 25, 3.2 °C at second 45 and 14.3 °C at second 70.
Two very different rates
Between seconds 5 and 25 the temperature rises by only 0.1 °C, about 0.005 °C per second. Between seconds 45 and 70, by contrast, it rises by 11.1 °C, about 0.44 °C per second: nearly ninety times faster. The middle stretch, from 25 to 45 s, gains 2.6 °C and marks the transition between the two behaviors.
Why a plateau appears
A nearly constant temperature just above 0 °C is consistent with ice that is melting. While ice and liquid water are both present, the energy the system absorbs goes mainly into breaking down the structure of the solid rather than raising the temperature. That is why the graph flattens. Once little or no ice remains, the same energy warms the liquid water and the slope increases.
One point worth stating clearly: during melting, water absorbs energy; it does not release it. Release belongs to the reverse process, freezing.
What these data cannot show
Four points leave large gaps. We do not know exactly when the plateau ended: it may have lasted until shortly before second 45, or ended soon after second 25. Nor can we be sure the final rise is a straight line. The times also give positions within the recording, not readings from an independently calibrated clock. And with a maximum of 14.3 °C, there is no evidence of boiling at all: that part of the curve simply does not appear in these data.
Your turn
Before looking at more frames, make a prediction: would a reading at second 35 be closer to 0.6 °C or to 3.2 °C? You can explore the phenomenon in the heating and cooling curve lab and use it in class with the heating and cooling curves inquiry lesson.