Physics and chemistry · Assignment design
How to design and assess a remote lab assignment: a Boyle’s law example
Before asking for a lab report, decide what a student would need to show to demonstrate that they can interpret an experiment. A completed table proves little if you cannot tell where the data came from or how they support the conclusion.
This guide proposes a Boyle’s law activity for students who already know about pressure, volume and inverse proportionality. It includes a ready-to-use student brief, a 20-point rubric and feedback examples. The aim is to assess experimental reasoning through a short, verifiable submission.
1. Define what the submission must show
Instead of “understand Boyle’s law”, set an objective you can check in the submission: collect pressure and volume pairs from an identified trial and decide, with calculations and at least one explicit limitation, to what extent they support PV remaining approximately constant.
Carnegie Mellon’s Eberly Center recommends aligning the task and the assessment criteria with the learning objectives. In this activity, that means asking for distinct evidence for observing, calculating and arguing.
| What you want to assess | What the student must submit |
|---|---|
| Planning the observation | A prior prediction and one sentence on what changes, what is read and what is assumed constant. |
| Recording evidence | A table with volume, pressure, trial, units and reading notes. |
| Using the model | PV products and one worked calculation with units. |
| Arguing and reviewing | A conclusion supported by specific rows and a check that would improve the evidence. |
2. Choose one trial and clarify what repeating it means
The Boyle’s law lab from LabsLand and UNED Costa Rica lets students work with a real syringe-and-sensor setup. In this activity, students navigate recordings of real trials rather than operating the equipment live. Returning to the same moment lets them check a reading; it does not produce a new independent measurement.
For this activity, use the 60 mL syringe, trial 1, and five volumes: 60, 50, 40, 35 and 30 mL. This is the selection used in the public activity The PV constant challenge. Keeping to the same trial makes it easier to trace where each value came from. Before class, check your group’s access and where the work will be submitted.
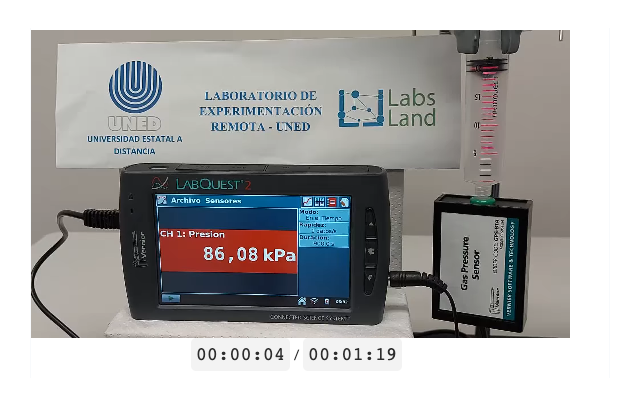
The reading used is absolute pressure: do not add atmospheric pressure. The activity sets a measurement range of 0 to 210 kPa, consistent with the Vernier GPS-BTA sensor manual. Any value outside this range should be flagged and left out of the physical comparison; it must not become evidence against the law. The volume shown on the syringe does not include the gas in the tubing and sensor. If that additional volume is d, the model applies to P(V + d), not exactly to PV. This can produce a systematic variation in the products calculated from the syringe scale; on its own, that variation does not identify the cause of the disagreement. Do not add a numerical correction without knowing d.
3. Give a brief with a clear endpoint
The following brief avoids an open-ended report with no length limit. You can copy it into your learning platform or use the printable worksheet (PDF).
Question: To what extent do the data from this trial support the idea that pressure is inversely proportional to volume (PV ≈ constant)?
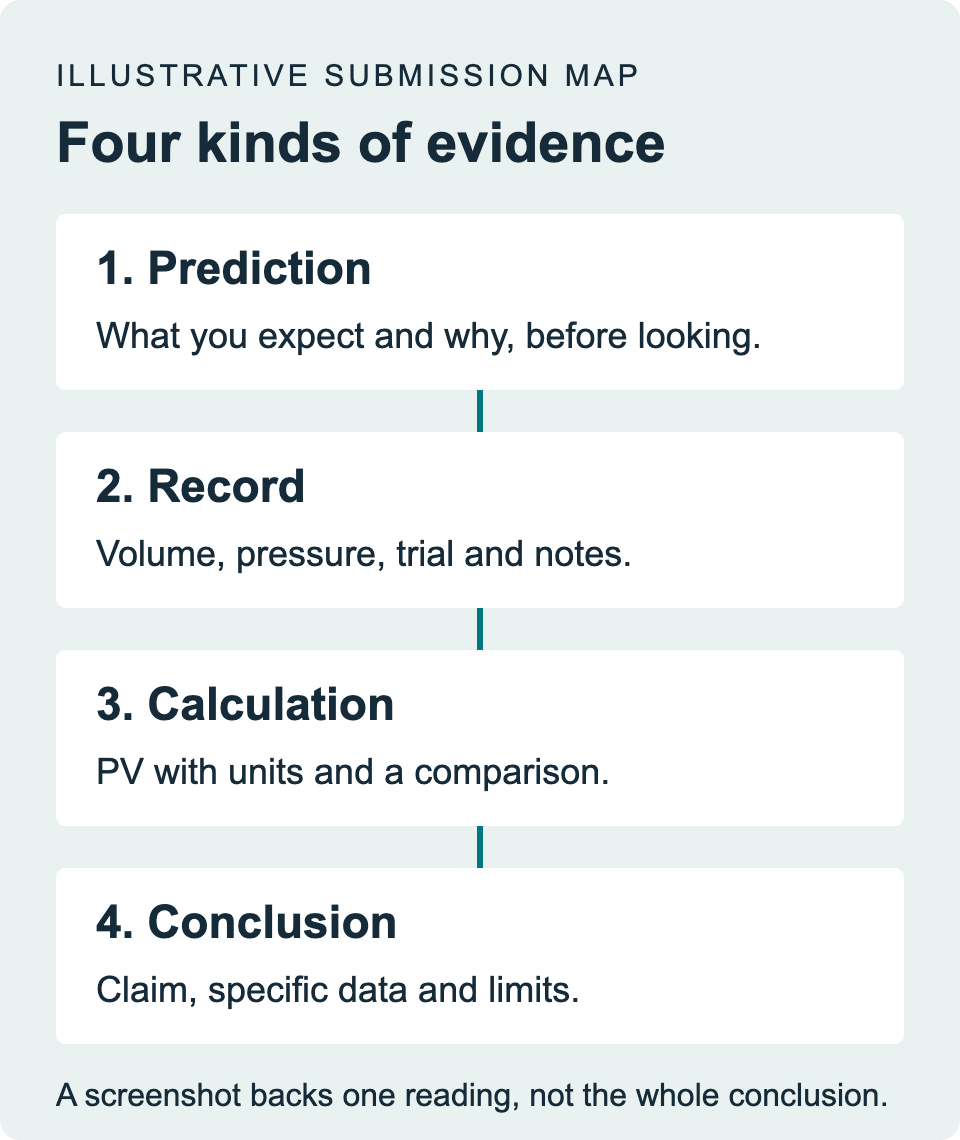
Submit: a prior prediction, five rows of data, one explained calculation, a conclusion of 120–180 words and a proposed check. Attach a screenshot that links one reading to its volume, or a precise reference to the trial and moment if you cannot attach images.
Do not ask yet for a long explanation of ideal gases in general. The question can be answered with the model PV ≈ constant, for a fixed amount of gas at approximately constant temperature. Temperature is not recorded in this activity; it is assumed to be approximately constant.
A possible 55-minute sequence
- Predict · 7 minutes. Write what will happen to the pressure as the volume decreases, and why. Keep the prediction even if it changes later.
- Get oriented · 5 minutes. Identify the syringe, trial, volume and pressure. Distinguish what is observed from what is calculated.
- Record · 15 minutes. Note the initial pressure at 60 mL and step through in 5 mL increments. Keep only the volumes in the table (60, 50, 40, 35 and 30 mL), checking that each pressure matches its volume. 55 and 45 mL are left out to keep the submission short and to follow the reference activity.
- Process · 10 minutes. Multiply each valid pressure by its volume and work through one calculation with units.
- Conclude and review · 18 minutes. Compare the products, write a conclusion and decide which reading or assumption is worth checking.
If students work in pairs, they may share the observation table as long as they say so. Ask for an individual conclusion and review decision. This lets you distinguish shared data collection from each student’s own interpretation.
4. Keep the original data separate from their interpretation
| V (mL) | Observed P (kPa) | PV (kPa·mL) | Reading note |
|---|---|---|---|
| 60 | — | — | — |
| 50 | — | — | — |
| 40 | — | — | — |
| 35 | — | — | — |
| 30 | — | — | — |
Leave the table blank for students to complete. It is also worth recording the trial number once, above the table. If a value is illegible, mark it as such and recheck the paused frame. Do not replace it with the number that “should” come out.
Pressure is expected to increase as volume decreases, and the PV products should be similar, within the limitations of the setup. Do not require identical products. Ask students to identify the lowest and highest valid PV and explain whether the difference changes their conclusion.
With a more confident group, the spread can be described with 100 × (maximum PV − minimum PV) / mean PV. This is a relative range for the series, not a sensor uncertainty or an error relative to a true value. Do not set a universal pass percentage based on this formula.
If graphing is one of the course objectives, add P against V and P against 1/V, with labeled axes and units. The full Boyle’s law investigation in Teach develops that comparison. If graphs are not part of the objective, do not add them just to lengthen the submission.
5. Publish the rubric before the activity
This rubric weights five aspects equally. The quality of a conclusion does not depend on it ending with “the law holds”: it can be cautious or point out that data are missing, as long as the decision is justified.
On small screens, scroll the table sideways to see all levels.
| Criterion | 4 · Complete | 3 · Nearly complete | 2 · Partial | 1 · Beginning |
|---|---|---|---|---|
| Plan and prediction | Distinguishes volume, pressure and what is held constant; predicts and justifies the relationship before observing. | Reasoned prediction with a minor omission in the variables. | Relevant prediction without justification, or partial confusion of variables. | Lists variables without an interpretable prediction. |
| Recording and traceability | Legible volume–pressure pairs, with units and trial identified; issues kept and explained. | Identifiable record with a minor omission. | Some of the pairs or their source cannot be checked. | Isolated data with no reliable link to volume. |
| Data processing | Correct PV products; shows a calculation with units and handles invalid readings explicitly. | One minor calculation or unit error, with a correct method. | Several errors, but the method is recognizable. | Operations with no clear link to the measurements. |
| Conclusion and limits | Links the claim to at least two rows and to the variation in PV; explains a relevant limitation. | Conclusion supported by data; limitation or comparison underdeveloped. | Describes a trend without justifying it with their values. | Restates the law without using the data. |
| Reasoned review | Reviews a specific row or decision; distinguishes rereading a recording from an independent trial. | Specific review with an incomplete explanation of what it checks. | Proposes repeating without specifying what or why. | Mentions an error without proposing a useful check. |
0 points: no relevant evidence for that criterion. Add up the five criteria: maximum 20 points. If you use a 0–10 scale, divide the total by 2. A documented access issue leaves the experimental part pending; it is not the same as submitting invented data.
When a reading is marked as illegible or out of range, credit how traceably the issue was recorded and allow the observation to be completed. Do not penalize honest recording as if it were a calculation error, and do not treat an insufficient table as proof of the relationship. Avoid deducting twice for the same arithmetic slip if the subsequent reasoning is consistent with that calculation.
6. Give feedback with an action the student can take
Illustrative examples of responses and how to comment on them.
| Response excerpt | Useful feedback |
|---|---|
| “The pressure goes up, so the law holds.” | The trend is relevant. Now compare two PV products from your table and explain what that comparison adds to observing that P increases. |
| “I replayed the video three times and got the same number.” | You have checked your transcription. Explain why rereading the same recording is not the same as obtaining three independent trials. |
| “I deleted the row that didn’t match.” | Restore the original row. Identify whether there was a reading, range or calculation problem, and justify how you will handle it in your analysis. |
| “The products vary, so everything is wrong.” | Quantify the variation using your values and point out a limitation of the setup. Explain whether that variation is enough to reject the model or whether it may be due to the setup. |
Offer a short revision: correct a row while keeping a record of the original value, or add the comparison missing from the conclusion. If you want to assess repeatability in another session, use Do two Boyle runs agree?, which compares different recordings at matching volumes.
Common mistakes when designing the task
- Grading a photo as an explanation. A screenshot supports one reading; it does not replace the argument or validate the whole table.
- Asking for “perfect data”. This encourages students to hide discrepancies. Assess how discrepancies are kept and investigated.
- Confusing real video with live control. In this activity, students navigate recorded trials. The evidence is experimental, but it is not a new physical run for each student.
- Penalizing an access failure. If access fails, collect the prediction and plan, and agree to complete the experimental evidence later.
- Changing the rubric while marking. Communicate the criteria and the submission format before the observation begins.
Student worksheet (PDF) · Rubric and marking guide (PDF)
Start with the preview of The PV constant challenge to review the experimental path. The page lets you prepare a session once you sign in as a teacher; check your account’s access before assigning it. The rubric in this guide is a proposal to adapt to your own assessment system.