
4. Circuits with diodes
Note
This is part of the LabsLand Electronics laboratory documentation for educators using the LabsLand Hive. If you want to use this lab in class, check Use this laboratory in class.
The components available for experimenting with diodes are:
1 1N4007
1 Zener 3.3V
On LED-equipped Hives: 1 green, 1 yellow and 1 red LED (see Light-emitting diodes)
Resistors of 1kΩ and 10kΩ
Capacitors of 1uF, 10uF and 0.1uF
4.1. Diode characteristic curve
The Hive remote laboratory can be used to obtain the diode characteristic curve. In this experience it can be verified what it happens when the diode is polarized in direct and in reverse. For that:
Carry out the following assembly
Set the supply voltage. Use the +5VDC source.
Measure the voltage drop on the diode
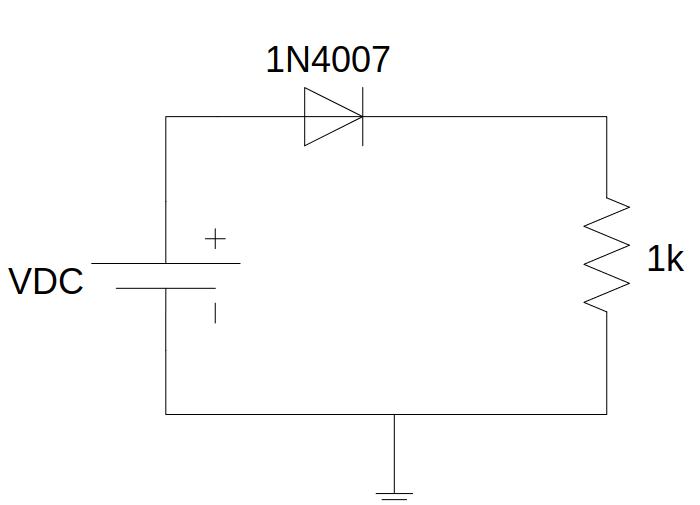
Fig. 4.1.1 Circuit to obtain the characteristic curve of the diode
Implementation on the remote laboratory:
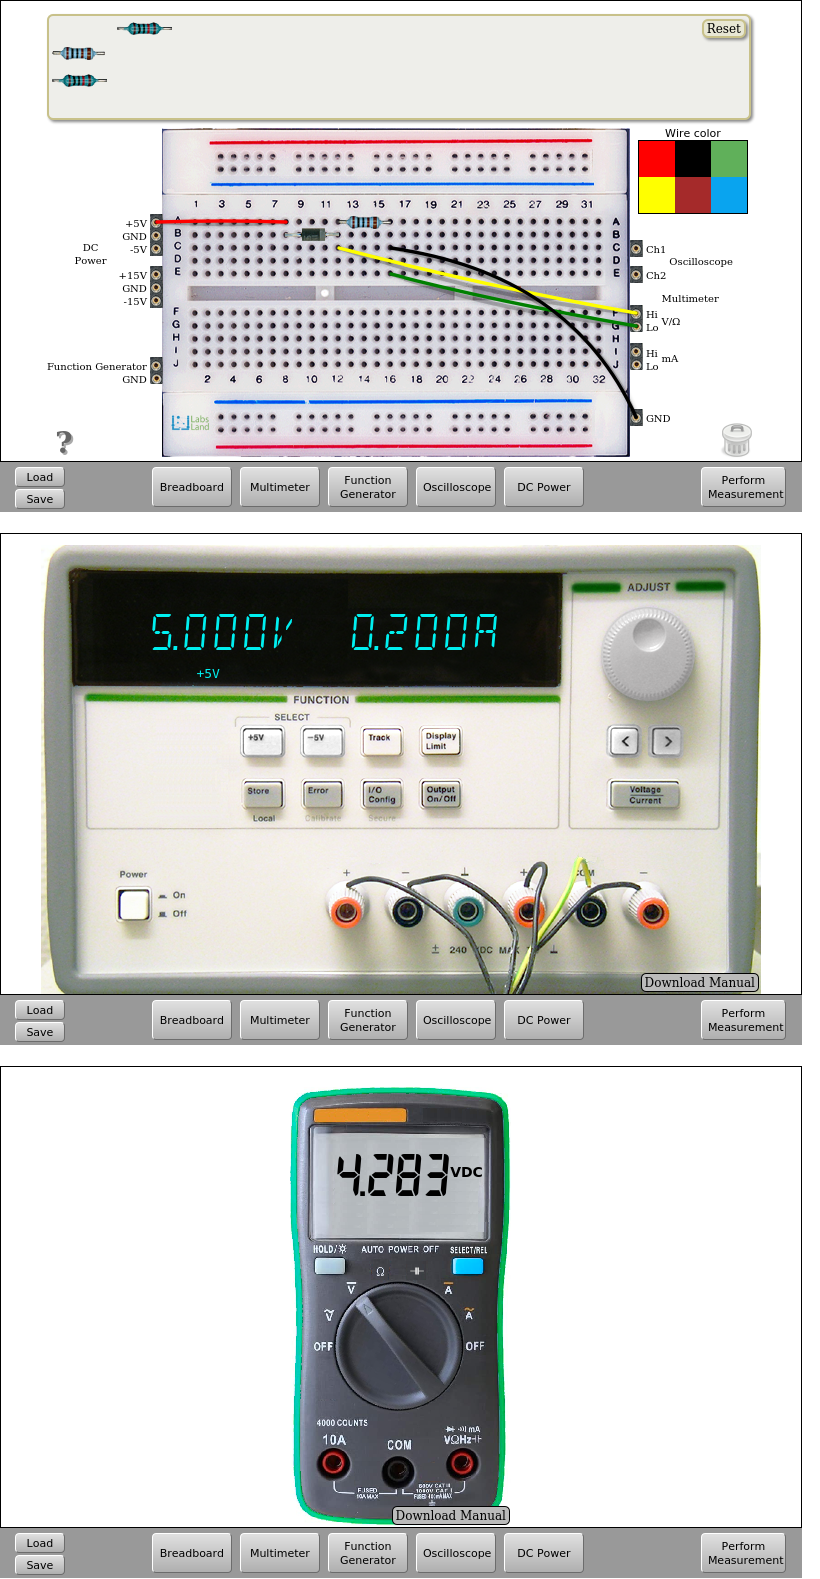
Fig. 4.1.2 Implementation on the remote lab. Diode in direct possition | Download this circuit
In this circuit it is also possible to measure the current flowing through the diode. To do this, connect the multimeter between the diode and the resistor or before the diode.
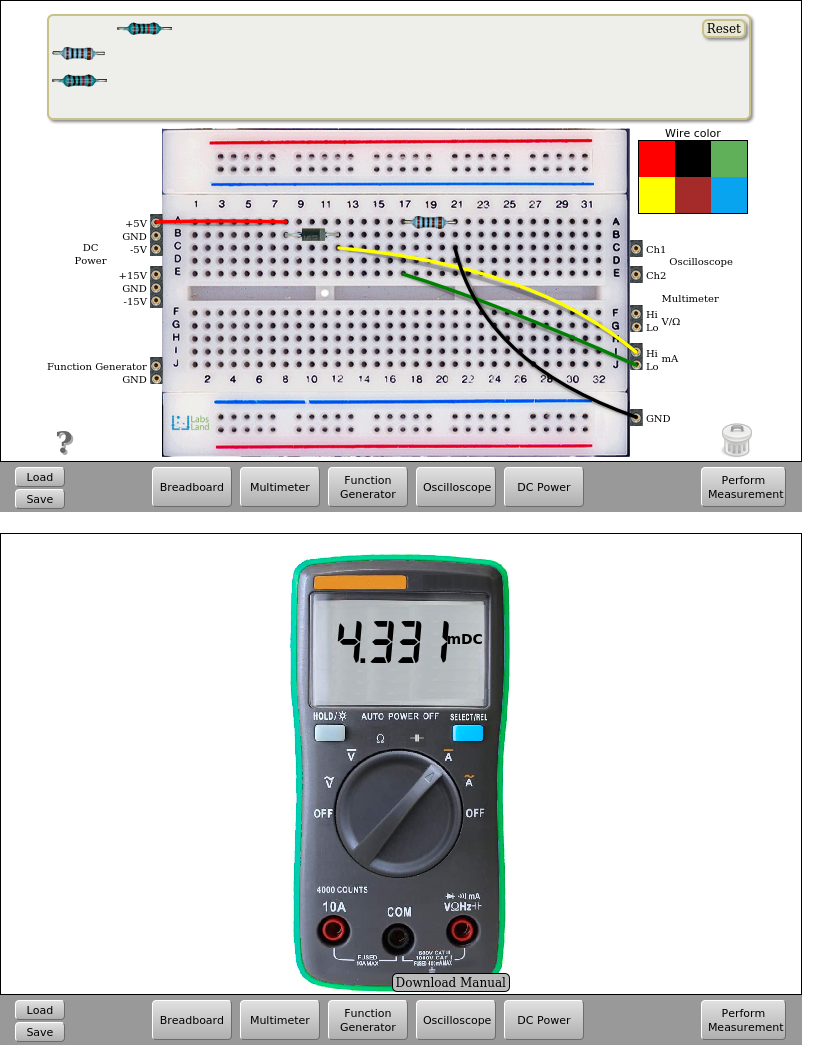
Fig. 4.1.3 Measuring the current on the diode. VDC=+5V | Download this circuit
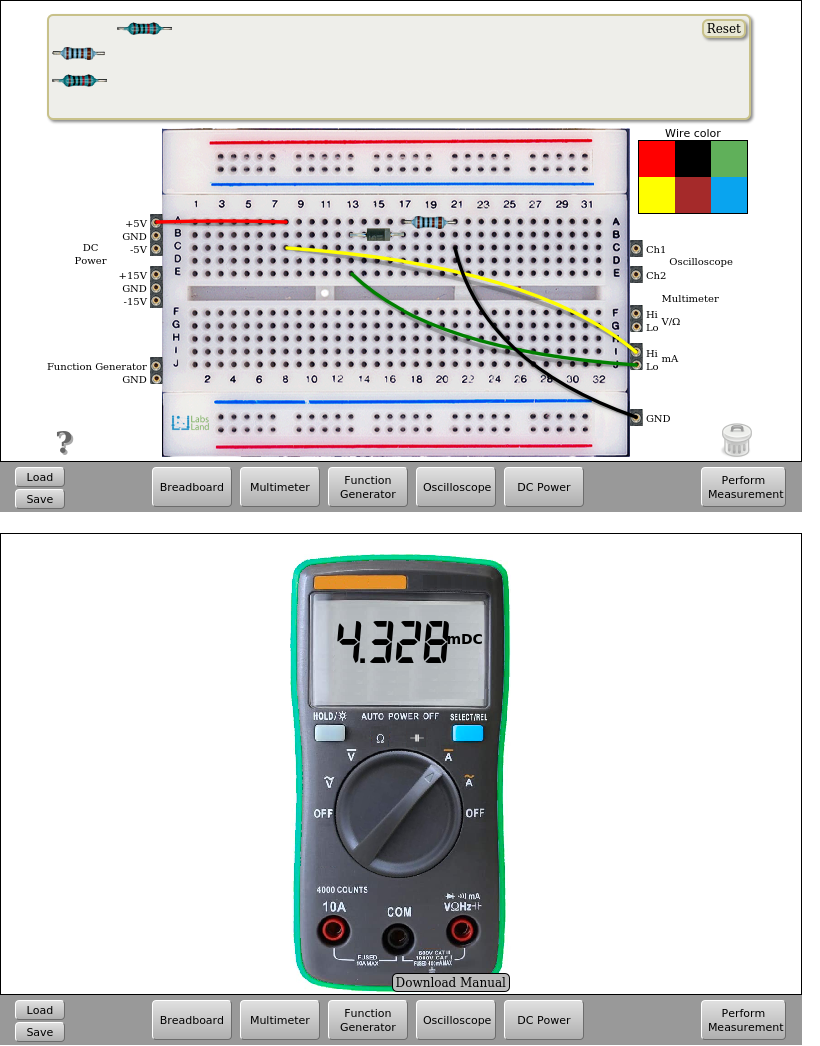
Fig. 4.1.4 Measuring the current on the diode. VDC=+5V | Download this circuit
4.2. Half-wave rectifier
If, in the previous circuit, the DC source is replaced by the function generator and the circuit is supplied with a sinusoidal signal, we can observe the operation as a half-wave rectifier.

Fig. 4.2.1 Half-wave rectifier
In the circuit above, the diode can be connected in direct or inverse and observe how the diode rectifies the positive or negative half-cycle of the input signal in each case.
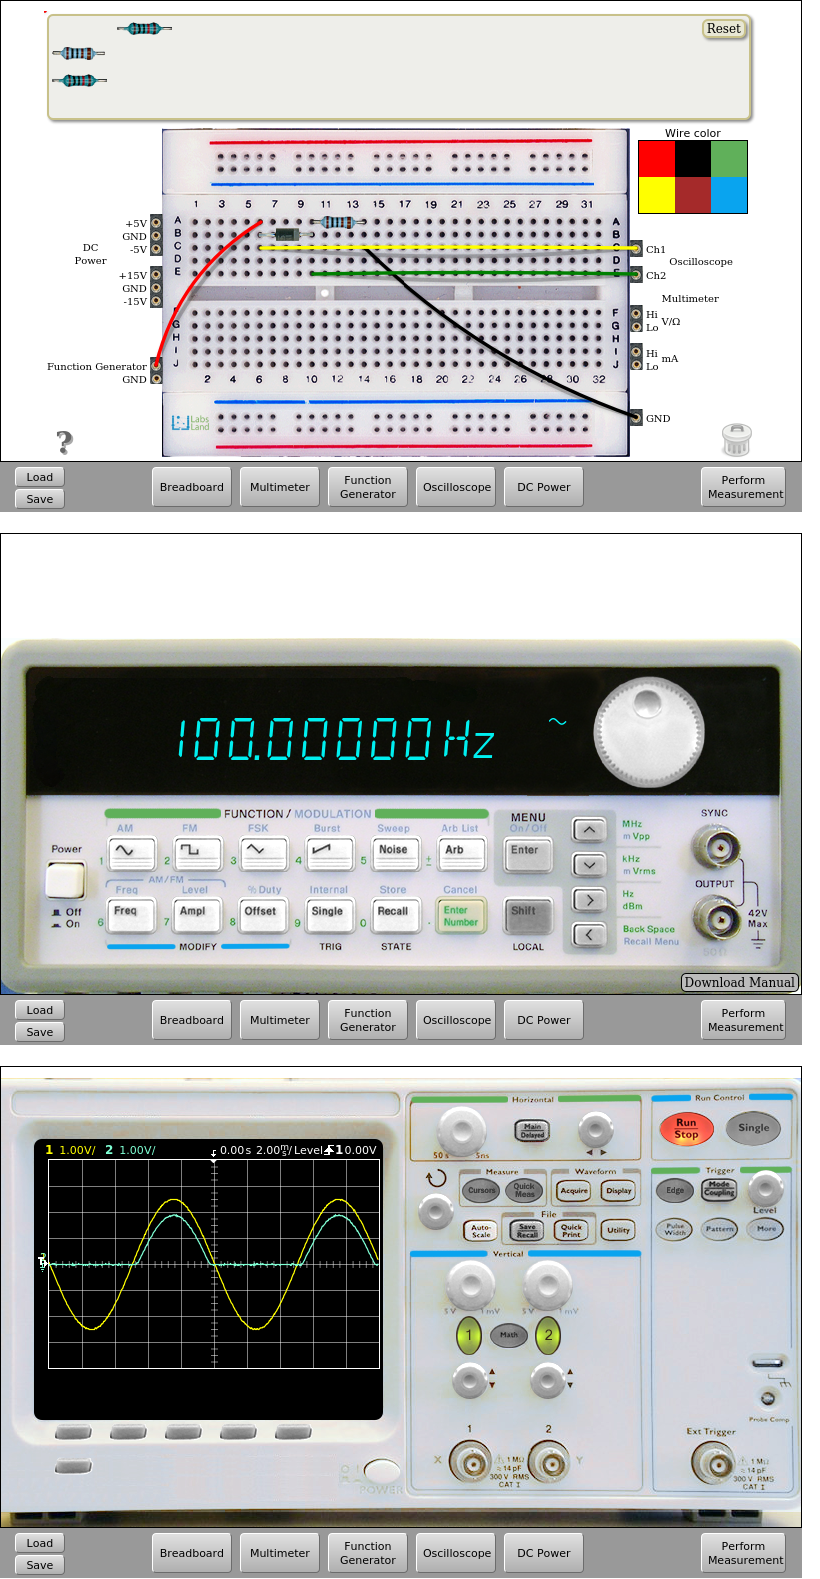
Fig. 4.2.2 Implementation on the remote lab of the positive half-wave rectifier (10.0 VPP, 100 Hz) | Download this circuit
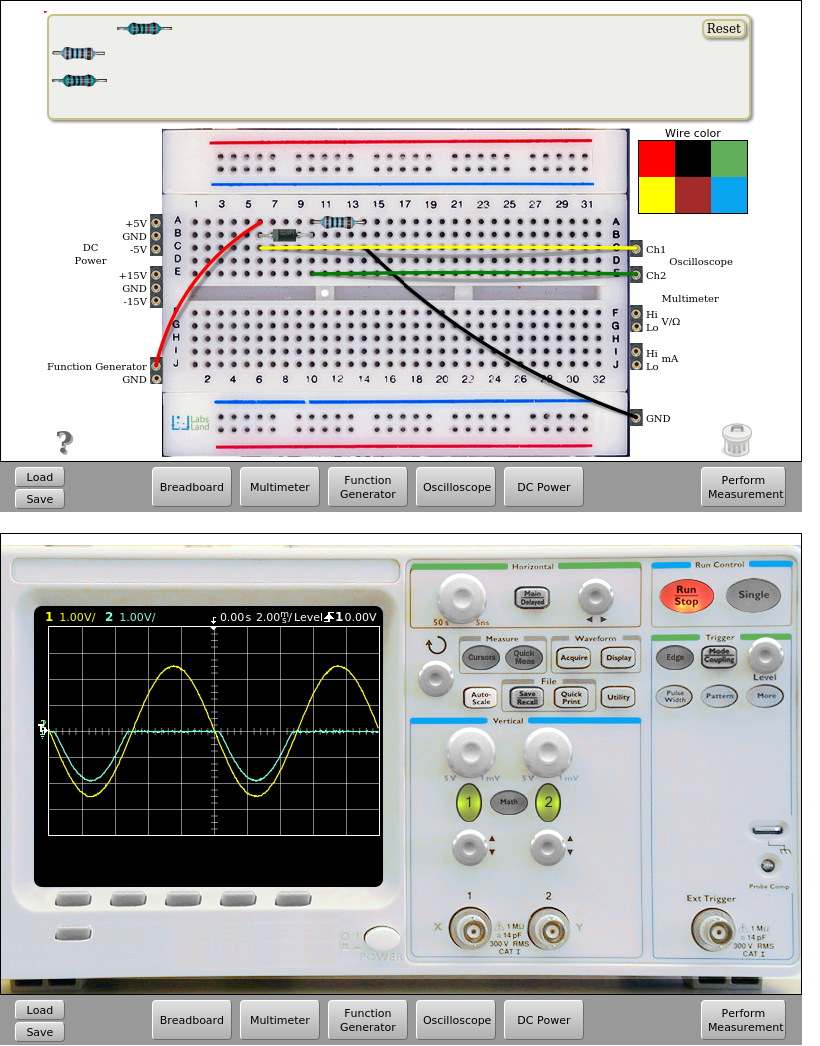
Fig. 4.2.3 Implementation on the remote lab of the negative half-wave rectifier (10.0 VPP, 100 Hz) | Download this circuit
4.3. Half-wave rectifier with output filter
A low-pass filter can be added to the previous circuit at the output to obtain a continuous signal. To do this, simply add a capacitor in parallel to the 1kΩ resistor. The available capacitor values are 1uF, 10uF and 0.1uF.
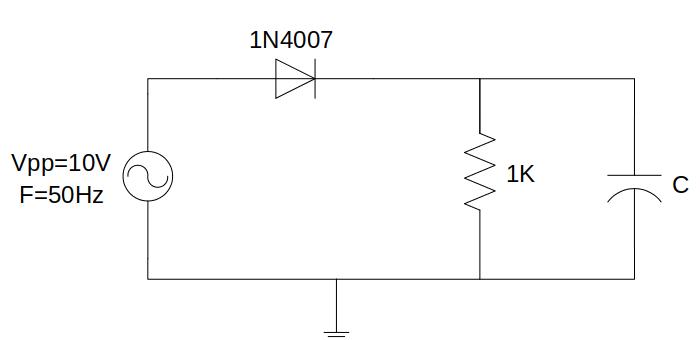
Fig. 4.3.1 Half-wave rectifier with output filter circuit
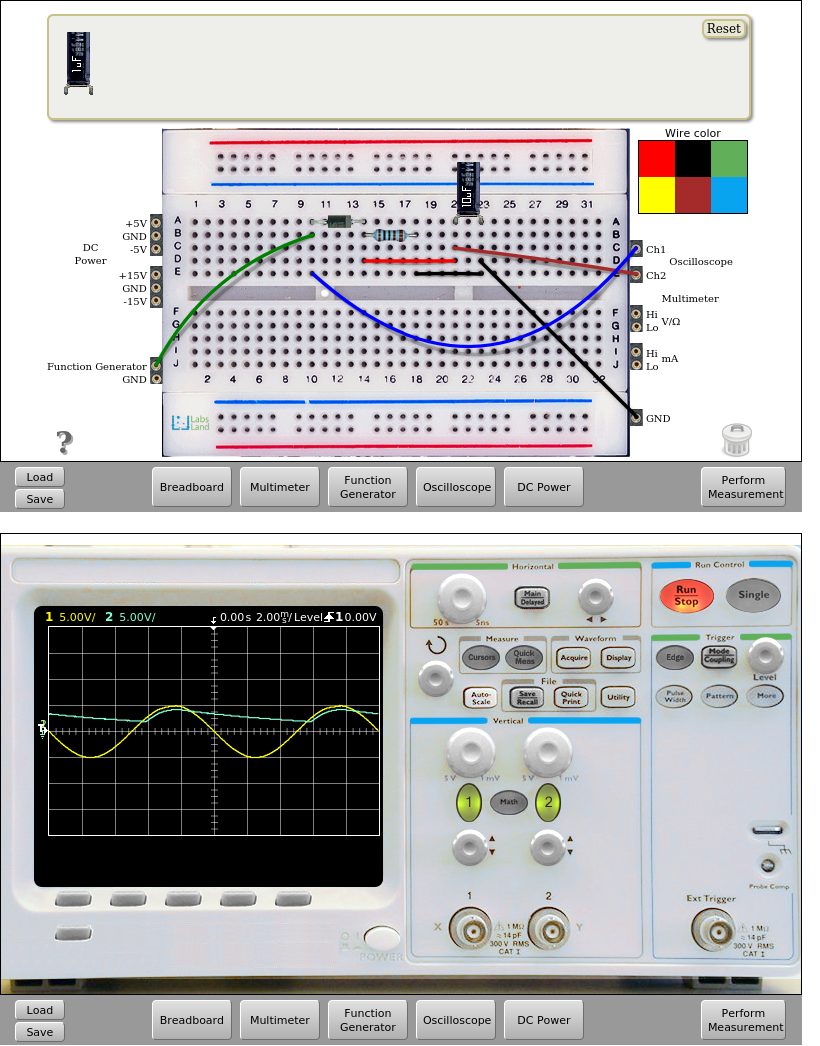
Fig. 4.3.2 Implementation on the remote lab of the half-wave rectifier with output filter (Function generator as before: 10.0 VPP, 100 Hz) with C=10uF. | Download this circuit
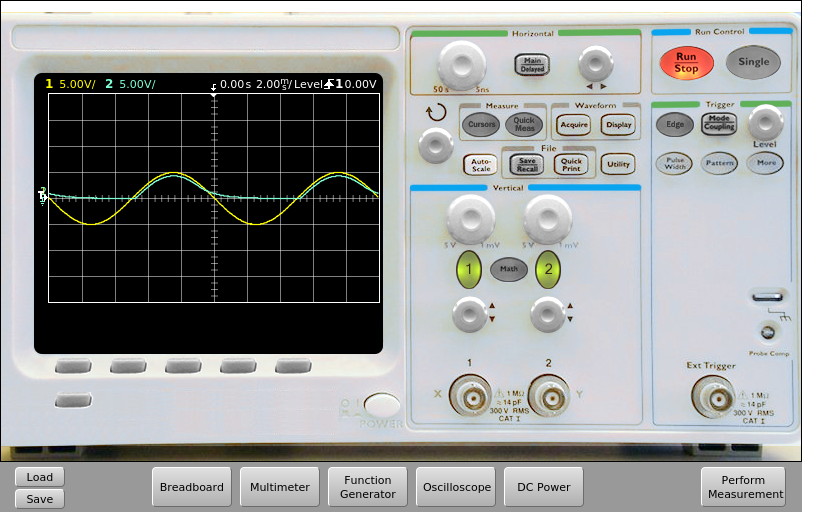
Fig. 4.3.3 Implementation on the remote lab of the half-wave rectifier with output filter, but using C=1uF. | Download this circuit
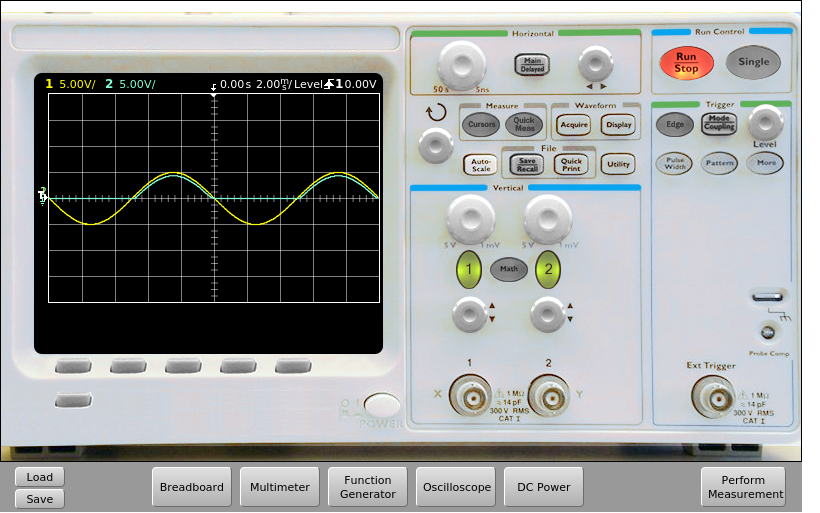
Fig. 4.3.4 Implementation on the remote lab of the half-wave rectifier with output filter, but using C=0.1uF. | Download this circuit
4.4. Zener diode voltage regulator
Through this experiment the operation of a Zener diode can be analysed, either with forward or reverse polarization. For this, the remote laboratory has a 3.3V Zener diode, a 470 Ohms resistor and a 1k resistor, which can be connected to the configuration shown at Fig. 4.4.1, in which the diode can be removed and see how it affects the voltage drop between both resistors.

Fig. 4.4.1 Circuit with Zener diode
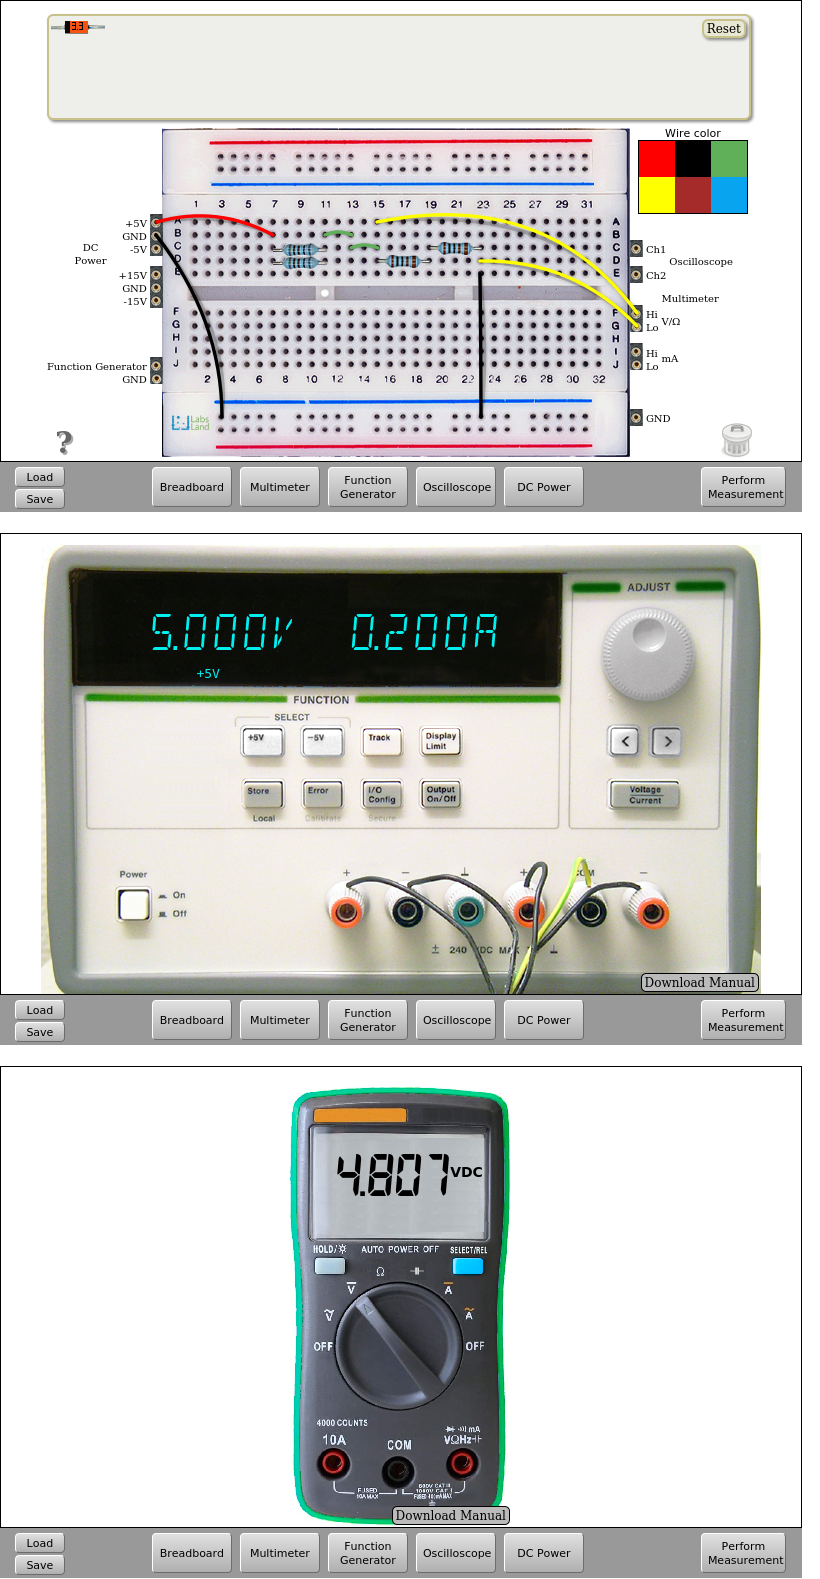
Fig. 4.4.2 Implementation on the remote lab | Download this circuit
In the previous circuit it is also possible to connect the multimeter before the 470 ohms resistor and in front of the Zener diode to obtain its characteristic I-V curve varying the value of the supply voltage VDC and taking measures of voltage and intensity on the circuit.
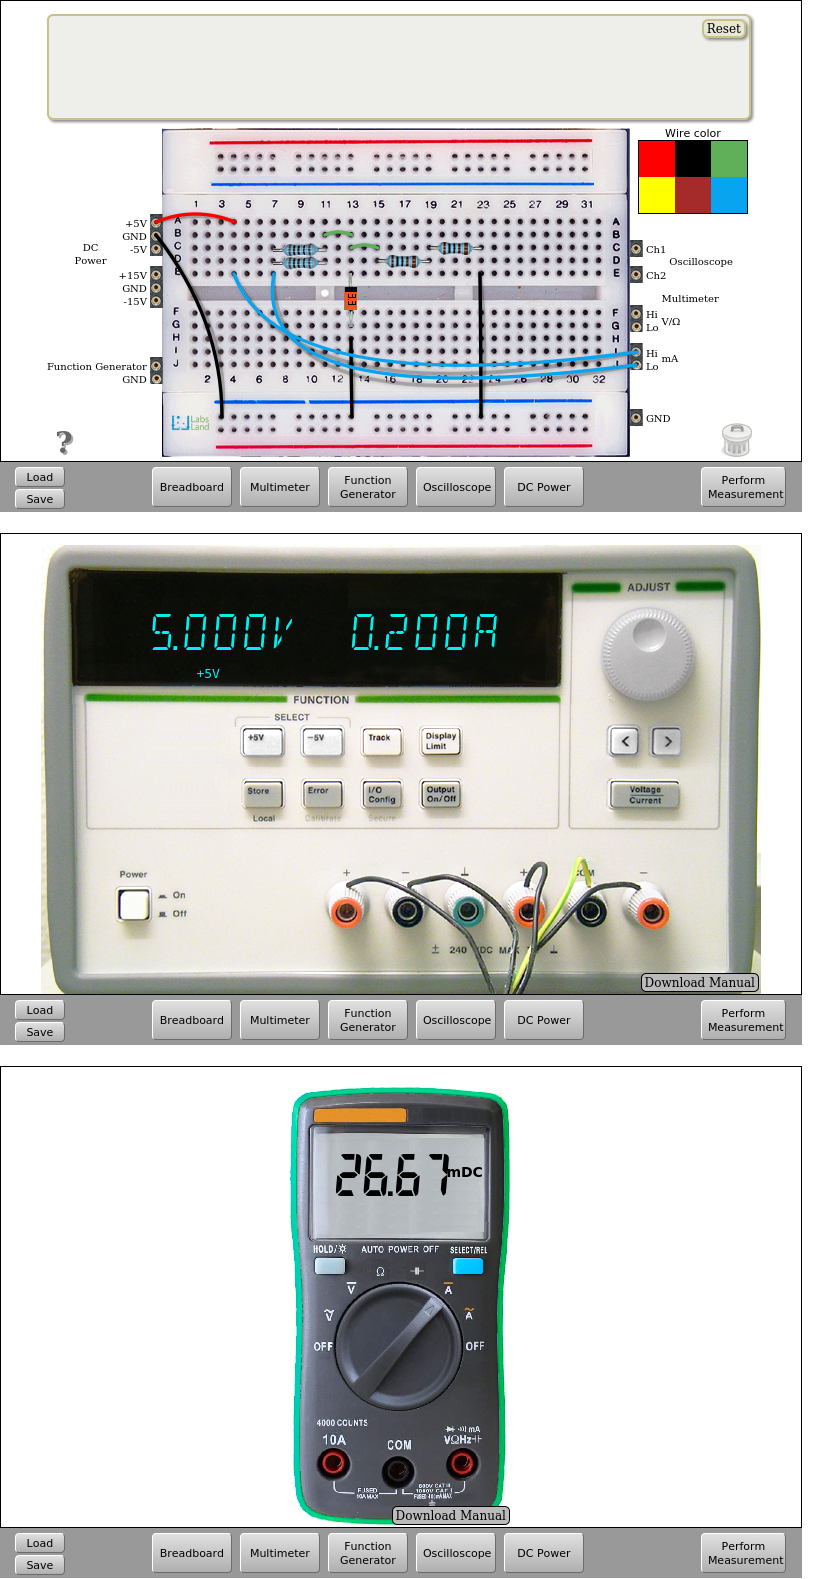
Fig. 4.4.3 Measure of the currents on the Zener circuit (1) | Download this circuit
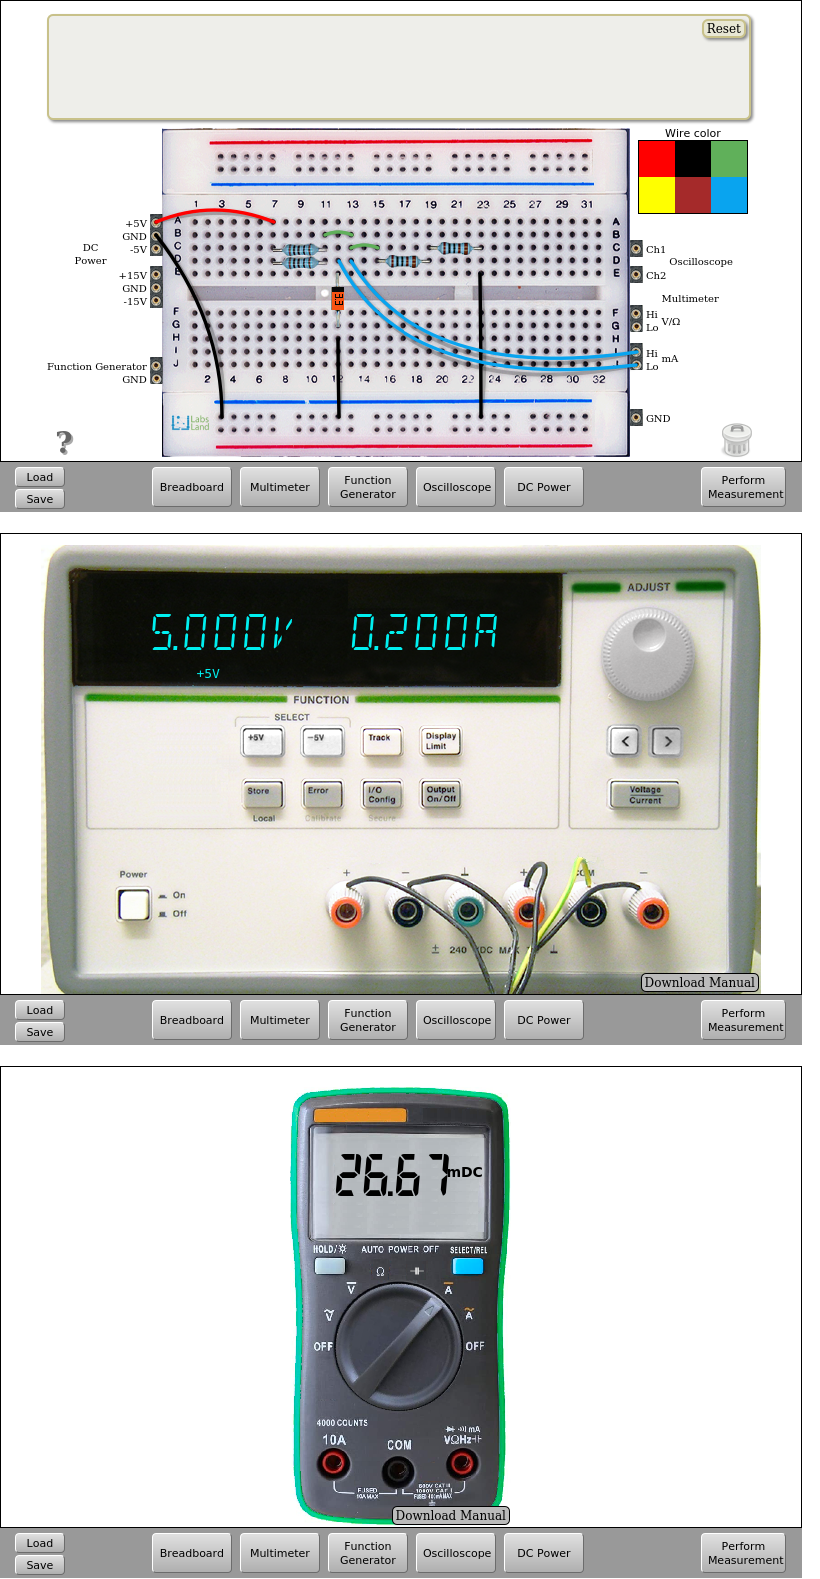
Fig. 4.4.4 Measure of the currents on the Zener circuit (2) | Download this circuit
4.5. Light-emitting diodes (LEDs)
LED-equipped Hives provide one green, one yellow and one red LED. These examples use the positive DC supply, up to 5 V, and a separate 1 kΩ series resistor for each LED. The existing 10 kΩ circuits remain supported; these examples use 1 kΩ for greater LED current and visibility.
An LED is polarized: connect its anode (A) to the resistor and its cathode (K) to ground (0 V). The cathode is identified by the flat edge and dark band on the breadboard symbol; its position changes when the component is rotated. Do not connect an LED directly to the supply or bridge its resistor with a wire.
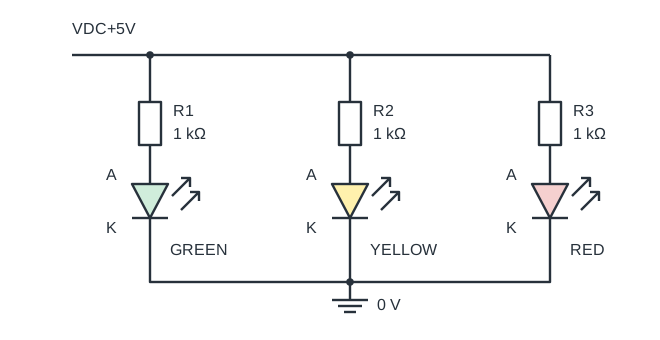
Fig. 4.5.1 Three independent LED branches. A: anode; K: cathode. Use any one branch, any two, or all three.
4.5.1. Available configurations
One LED: green, yellow or red, with one 1 kΩ resistor.
Two LEDs: green–yellow, green–red or yellow–red, with two separate 1 kΩ resistors.
Three LEDs: green, yellow and red, with three separate 1 kΩ resistors, as shown above.
The LEDs share the supply but retain independent resistor-limited branches. Only one LED of each colour is available. These examples do not cover series-connected LEDs or shared-resistor arrangements; other arrangements depend on the permitted circuits.
4.5.2. Downloadable circuits
These examples use the compact LED symbol, with leads three hole intervals apart and separate physical holes for wires and component leads. Open them in a freshly loaded Hive page. Older saved circuits keep their original LED spacing.
Load these files through Load circuit in Hive. Each file sets the positive supply to 5 V and connects the multimeter to measure the LED voltage. In the three-colour circuit, the multimeter measures the green LED. To obtain a two-colour circuit, remove the unused LED branch and its wires; keep a resistor in each remaining branch. If you remove the green branch, reconnect the multimeter across a remaining LED.
The positive supply can be adjusted between 0.5 and 5 V. This changes the LED current and may change its visible brightness; all connected LEDs share this voltage. Camera brightness is not a calibrated current measurement. To determine branch current, measure the voltage across its 1 kΩ resistor and use I = V / 1,000 (volts and amperes).
The optional Estimated glow control illustrates the last successful result; it does not measure light or continuously simulate an edited circuit. Open How this works to see each LED’s estimated current and whether it uses a voltage reading or nominal component values. The estimate is not calibrated, and different colours are not a common brightness scale. Editing the circuit clears the illustration; unsupported cases show that the estimate is unavailable. See Working with LEDs for placement guidance and the distinction between estimates, measurements and cameras.
Note
These circuits require an LED-equipped Hive available to your institution. Component availability can differ between Hives. They do not require or enable the negative supply, ±15 V supplies or function generator. These files describe physical Hive circuits; LEDs may be unavailable in Hive (sim).
That’s all in Circuits with Diodes. Continue in RC Circuits.