Get access now to LCAL2001: Science labs (ultraconcurrent)
For only:
$12.99One payment
6 months of access
Payment methods supported:
- DigiKey (Not available in every country)
- Credit or debit card
- PayPal
You need to create or use a LabsLand account to continue.
If you have a class or LMS link, use that instead. This purchase is individual access and will not add you to a class or institution.
Remote access to 41 laboratories included:
AC Electronics
Acid Base Titration II

Acid Base Titration III
Acid-Base Titration I
Advanced Buoyancy
Boyle's Law
Cellular Respiration

Cellular Respiration (with plot)
Common circuits
Conservation of Momentum
Diffusion laboratory - basic
Diffusion laboratory - data

Diffusion laboratory - full

Diffusion laboratory - plot
Exchangeable Acidity of Soils
Flowloop

Free Fall
Gay-Lussac's Law

Kinematics
Magnetic Field

Magnetic Field (with plot)
Microscope (Direct)

Microscope (Prep)

Optics
Pendulum
Planarians
Planarians (automatic)

Planarians (guess)

Radioactivity
Rolling Car
Snell's Law
Snell's Law (II)

Snell's Law (II) with verification
Snell's Law with verification

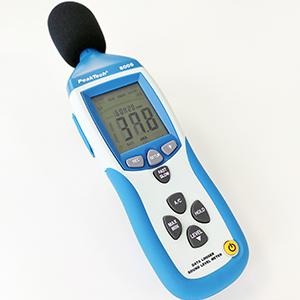
Sonometer
Spectroscopy
Spring
Thermal Expansion
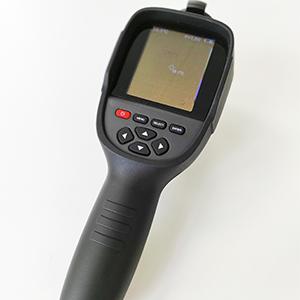
Thermographic Camera
Tree Leaves
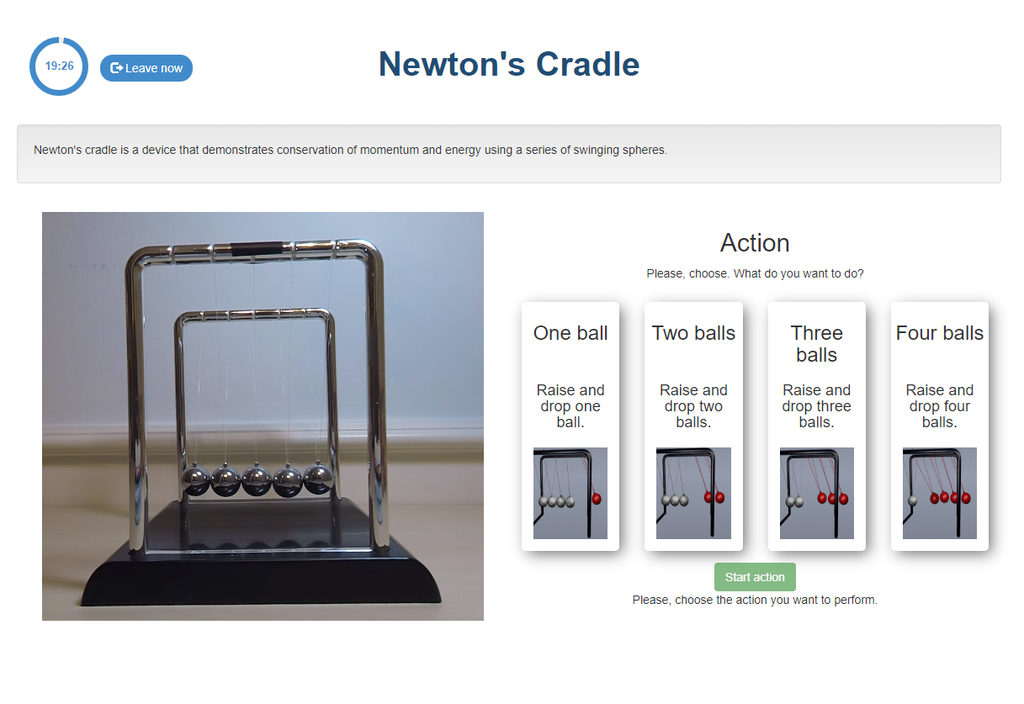
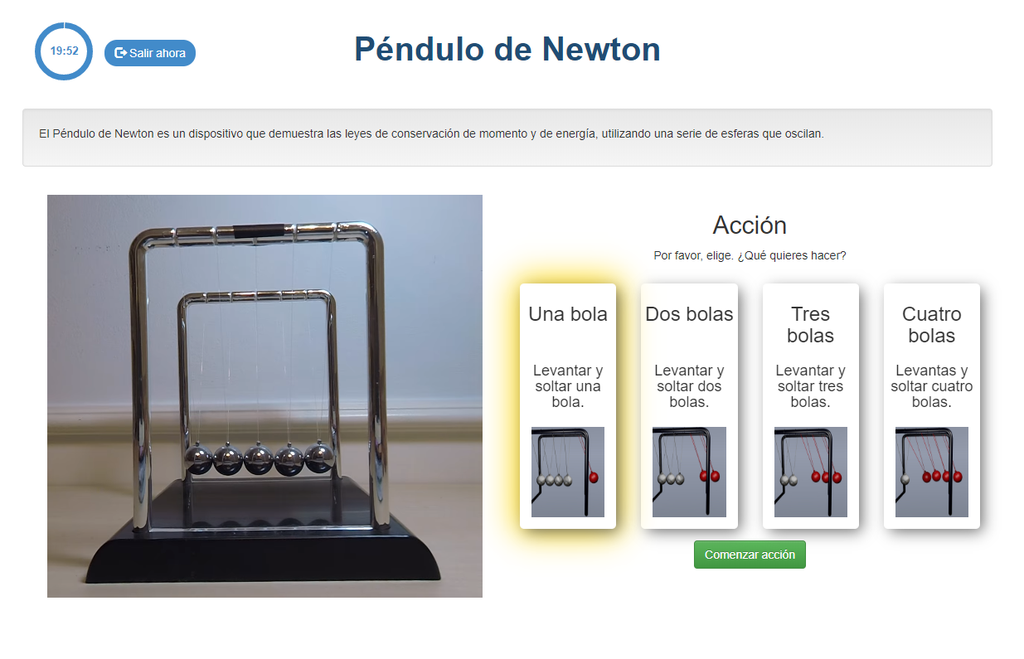
Newton's Cradle
AC Electronics
Acid Base Titration II
Acid Base Titration III
Acid-Base Titration I
Advanced Buoyancy
Boyle's Law
Cellular Respiration
Cellular Respiration (with plot)
Common circuits
Conservation of Momentum
Diffusion laboratory - basic
Diffusion laboratory - data
Diffusion laboratory - full
Diffusion laboratory - plot
Exchangeable Acidity of Soils
Flowloop
Free Fall
Gay-Lussac's Law
Kinematics
Magnetic Field
Magnetic Field (with plot)
Microscope (Direct)
Microscope (Prep)
Optics
Pendulum
Planarians
Planarians (automatic)
Planarians (guess)
Radioactivity
Rolling Car
Snell's Law
Snell's Law (II)
Snell's Law (II) with verification
Snell's Law with verification
Sonometer
Spectroscopy
Spring
Thermal Expansion
Thermographic Camera
Tree Leaves
Newton's Cradle
Trying to buy multiple licenses for a class? Contact us for bulk discounts
What is LabsLand?
LabsLand is the global network of remote laboratories.
The equipment is always real, not a simulation.
You control the real equipment with webcams through the Internet.
Access now. No need to wait for an equipment to be shipped.
No hidden costs: all included. No accessories or shipping costs.
Very easy to use: the equipment is already working.
Rent it only the months you need for your learning.
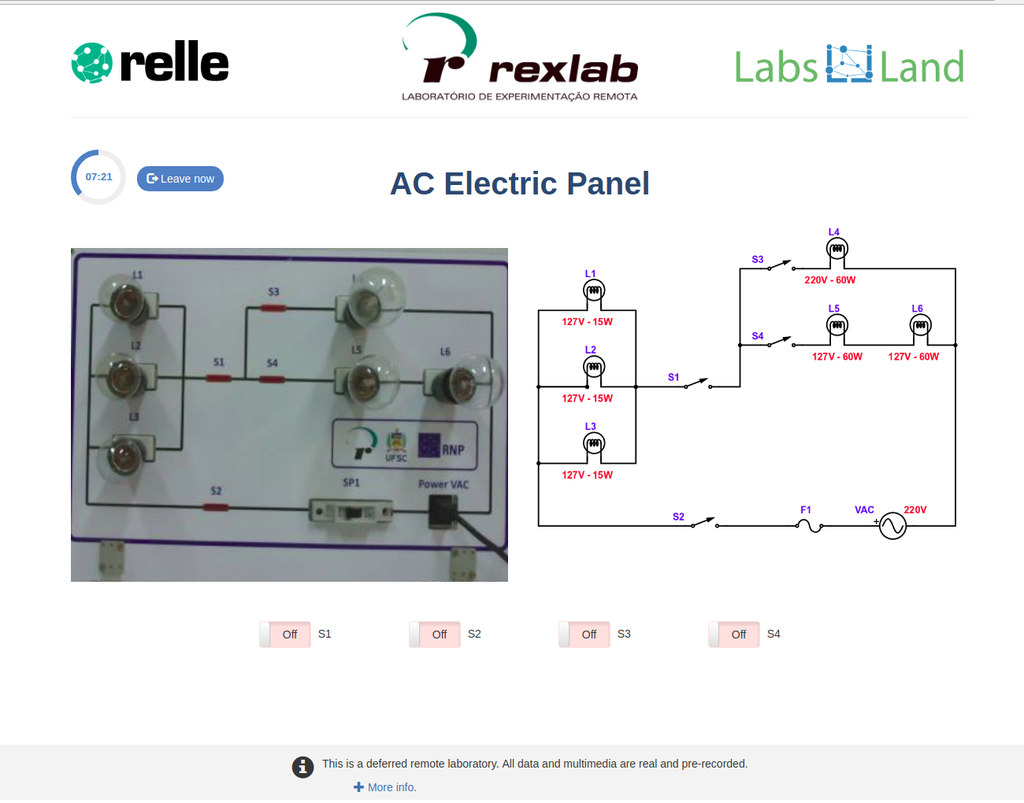
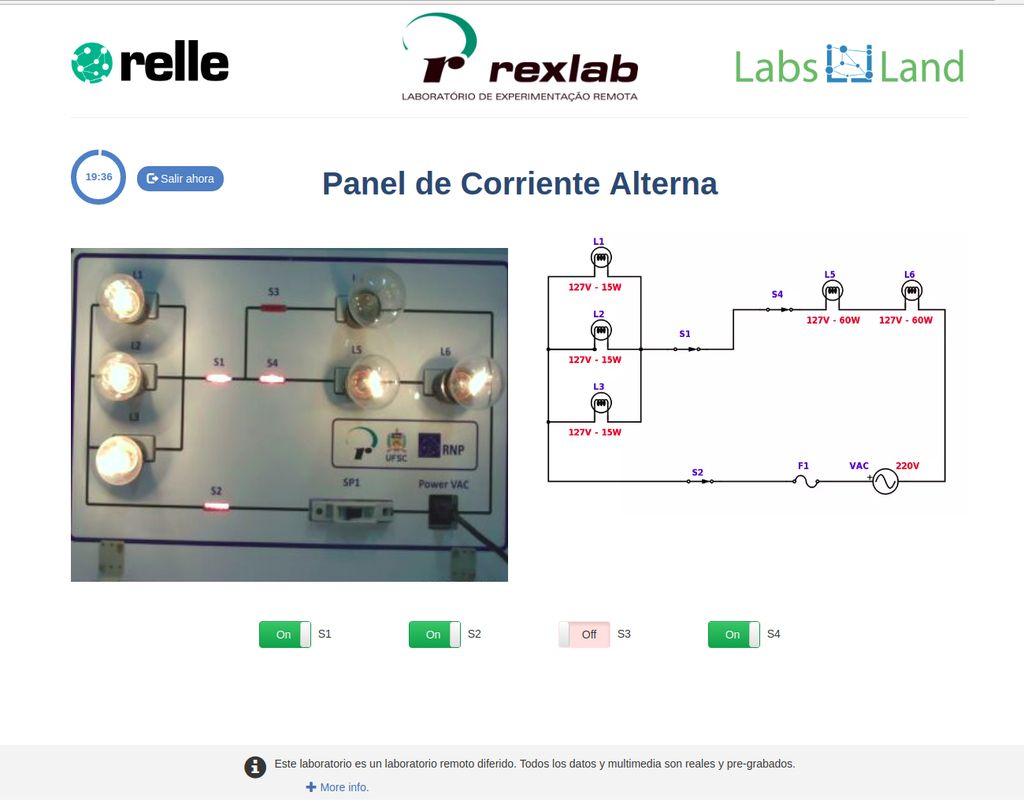
AC Electronics
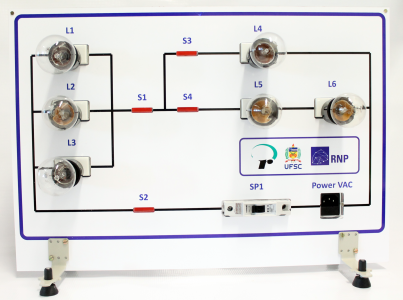
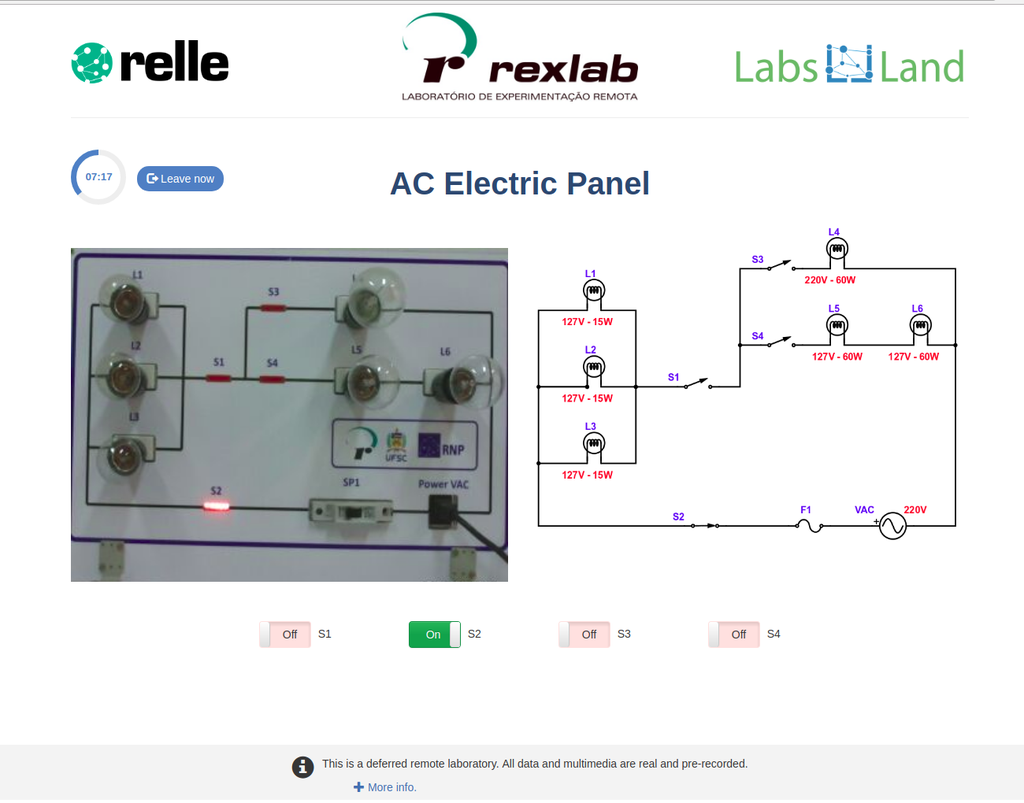
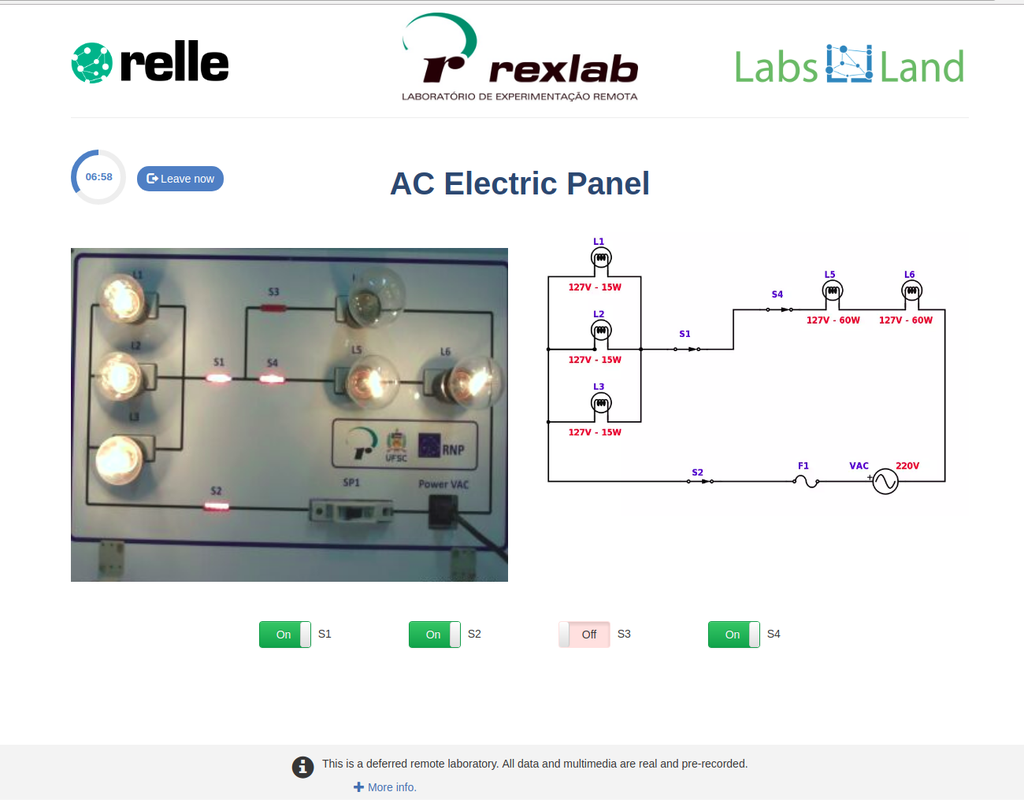
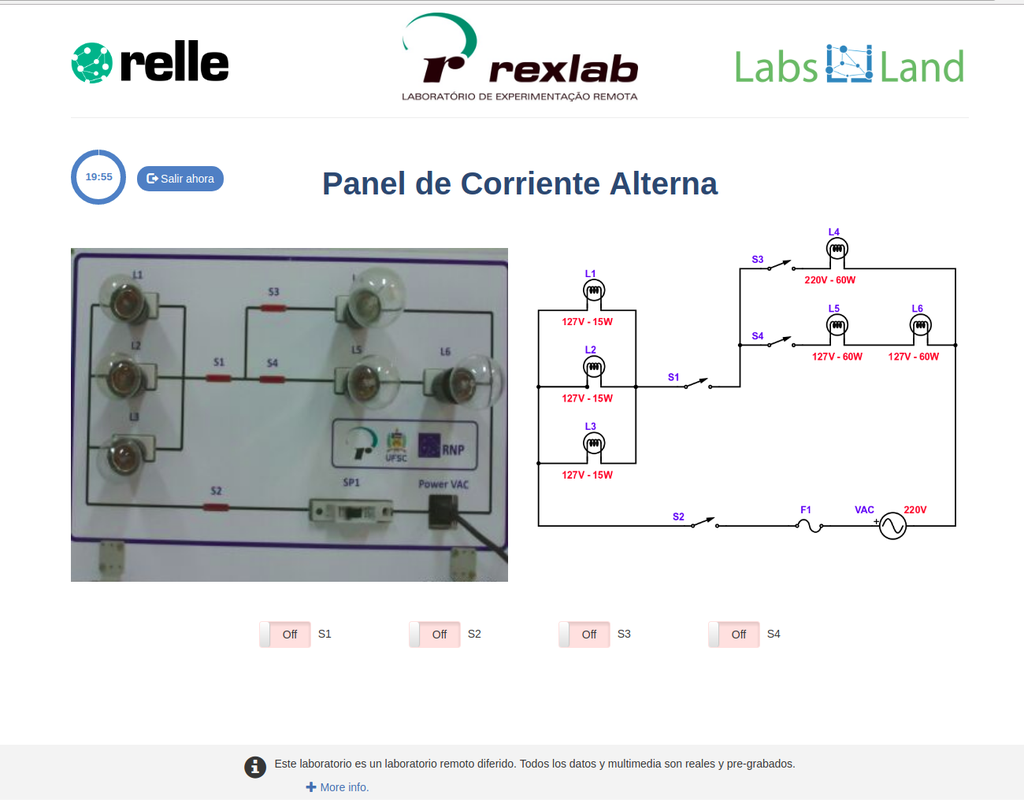
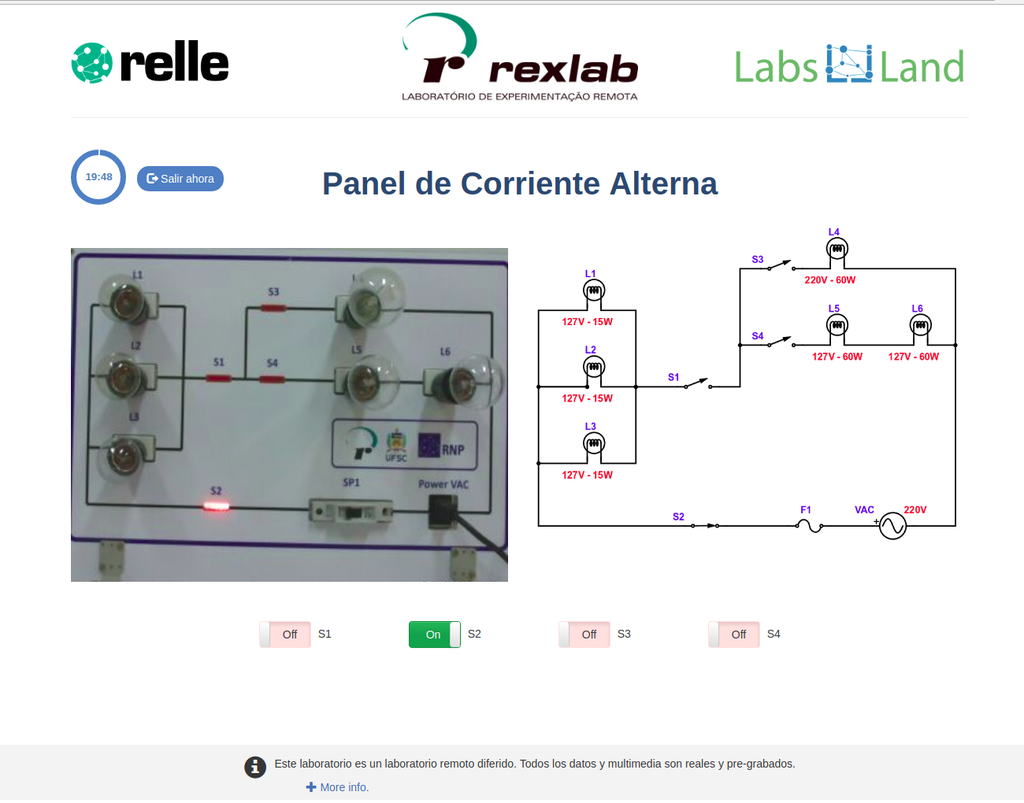
Study how alternating current (AC ) works by experimenting with several bulbs connected in series and / or parallel. Opening or closing the switches you want, you can see the effect on the intensity of light of each of the bulbs of the created circuit.
Acid Base Titration II
Summary
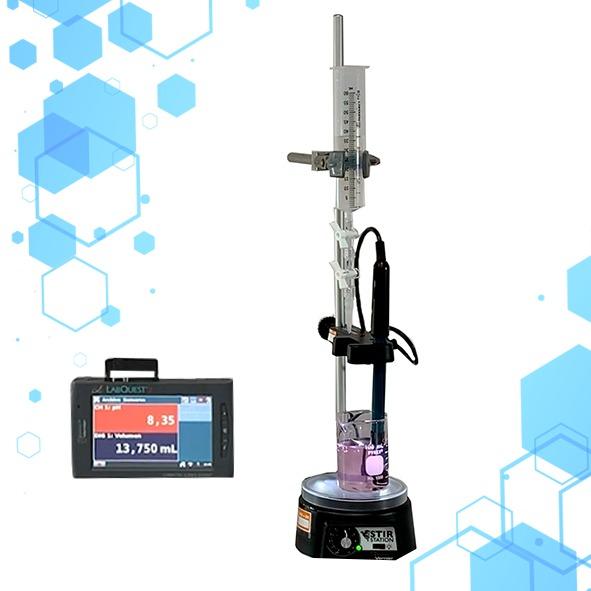
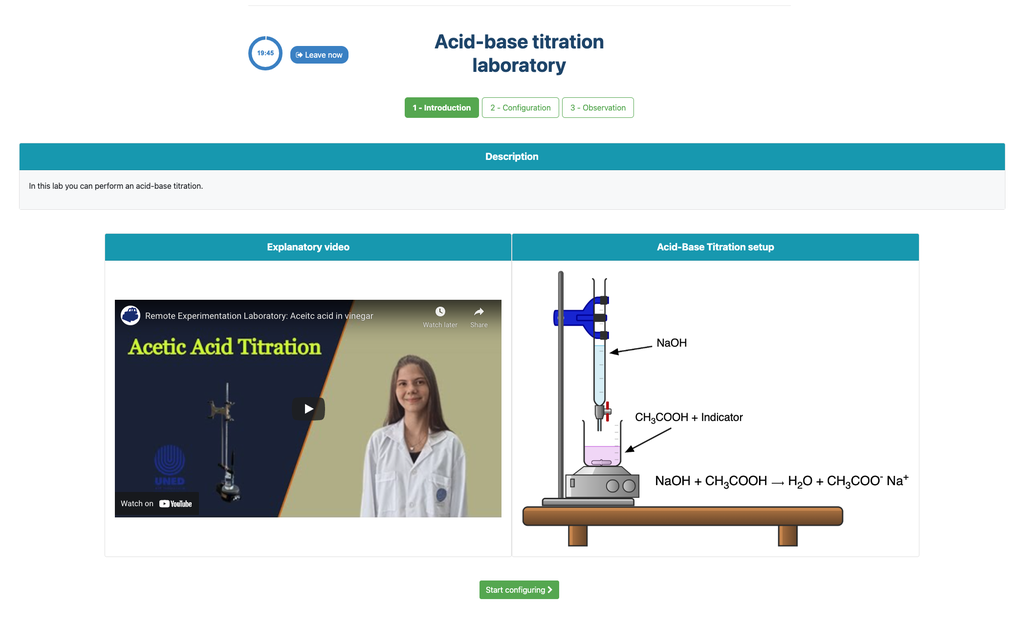
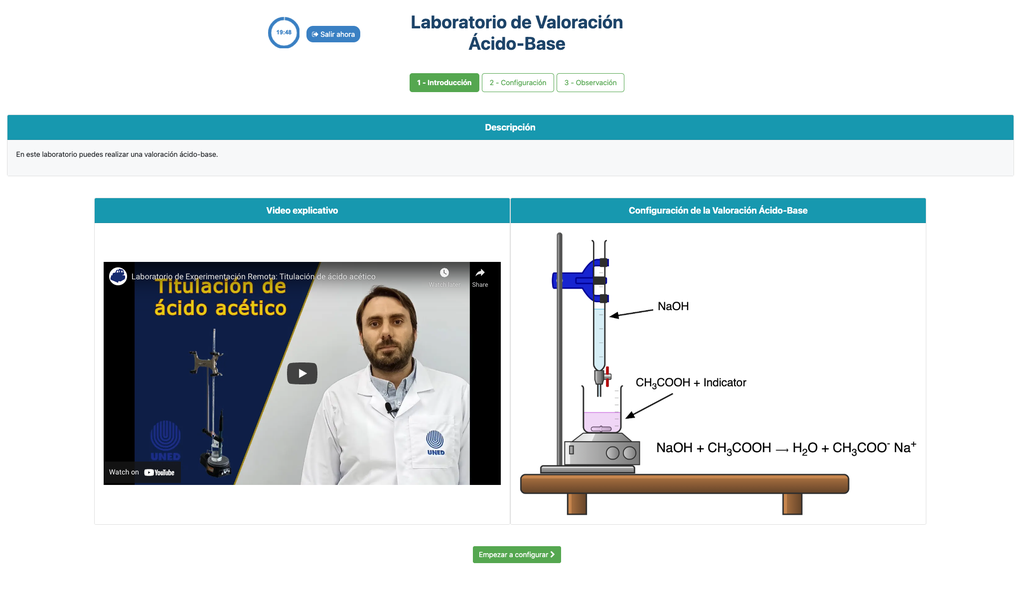
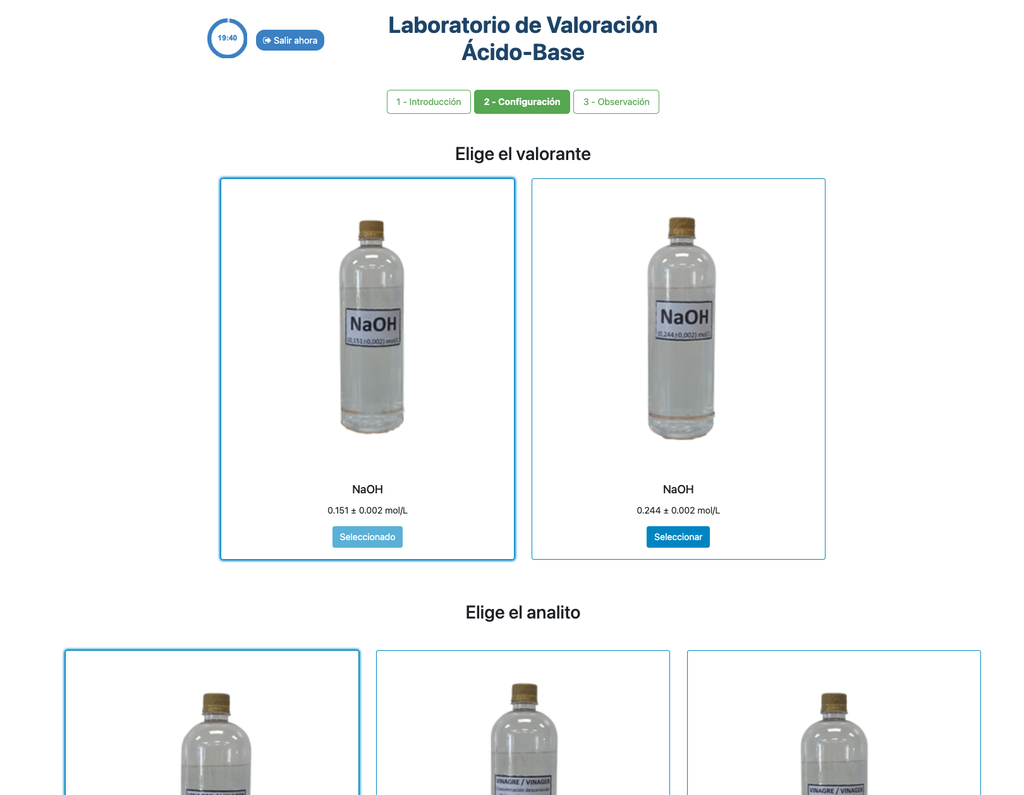
Perform an acid-base titration to determine the concentration of an unknown acetic acid solution using a sodium hydroxide titrant. This laboratory emphasizes visual measurements dealing with the meniscus of the burette, and supports two different configurations.
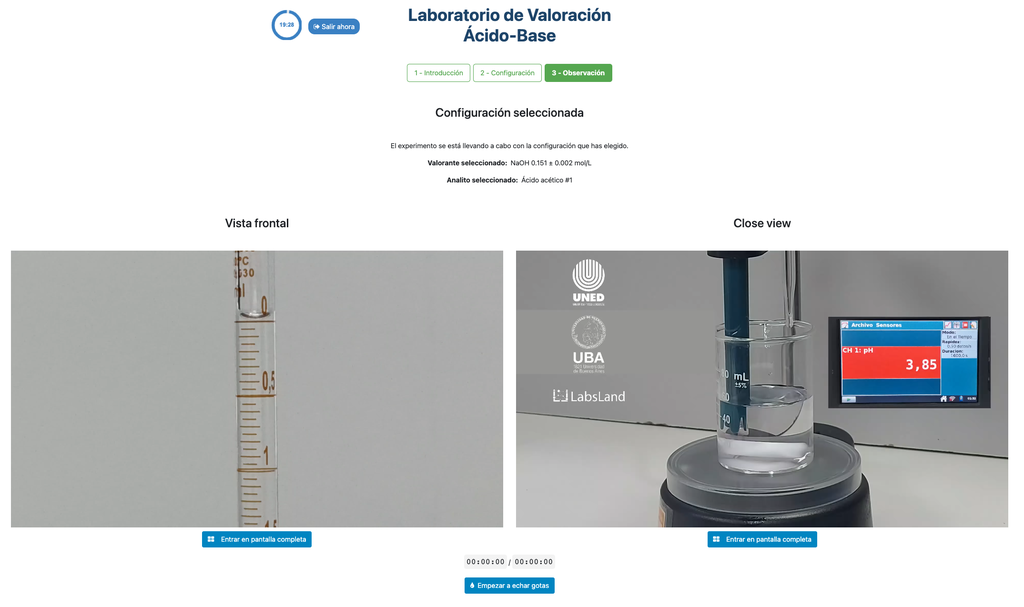
The first one is for a potentiometric approach: you will have access to a digital pH sensor and you can use it to determine when the unknown solution has been neutralized.
The second one is for a colorimetric approach: you can rely on the color change due to the presence of a phenolphthalein indicator, without having a digital pH sensor available.
Acid-base Titration
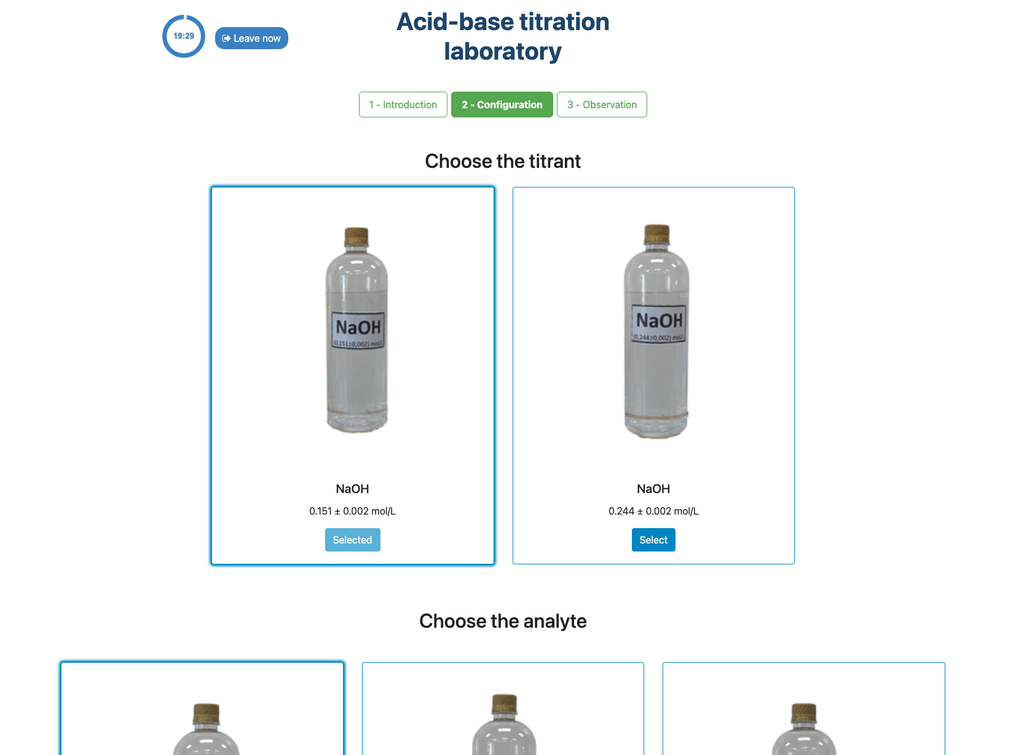
Titrations are a volumetric method that is based on measuring the amount of a known-concentration reactive (known as a primary standard) that is consumed by an unknown-concentration sample known as analyte.
The titration is conducted by adding the titrant to the analyte using a burette, so as to obtain a chemically-equivalent substance between the titrant and the analyte. This is known as the "equivalence point" and it is a theoretical value that cannot be experimentally determined.
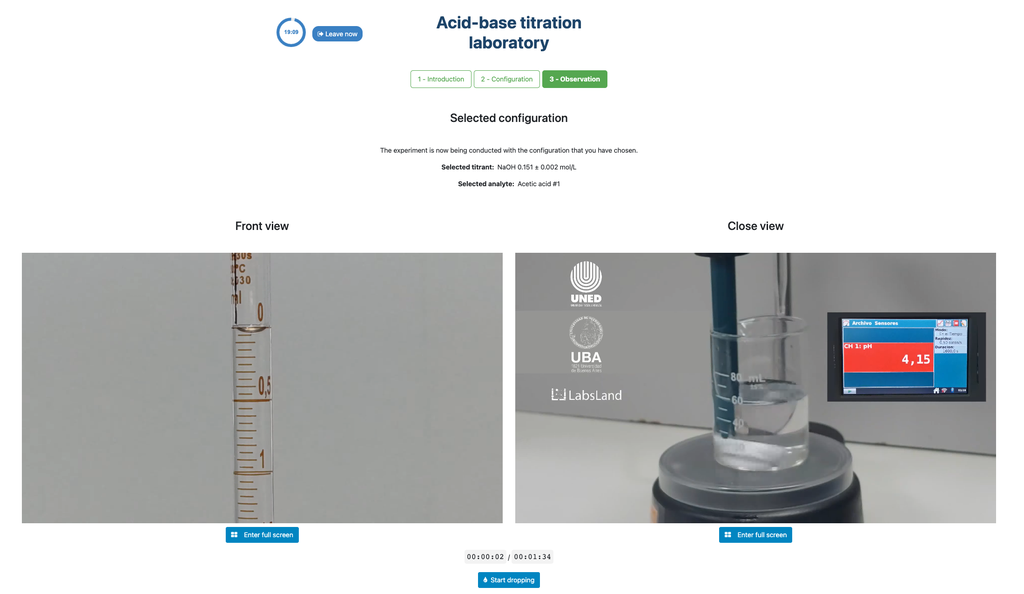
The experimental estimation of this point is obtained through an approximation known as "final point". This is determined through a physical change. In that case, the change in color of the solution is achieved after adding an indicator substance: a substance that changes color in certain ranges of pH.
For the acid-base titration we use a phenolphthalein indicator that becomes a light pink after a pH of around 8.4, which is a value that is very close to the equivalence point in the most common acid-base titrations.
Alternatively, in the potentiometric configuration, a digital pH sensor can be used to determine the “equivalence point”.
Colorimetric vs Potentiometric approach
The colorimetric approach relies on the color change provided by the phenolphthalein indicator. The potentiometric approach relies instead on the pH raise as measured by the digital sensor. In this version of the laboratory there are two different configurations available, one for each approach. In the colorimetric configuration students may not see the digital pH sensor.
Differences with the Acid-Base Titration II laboratory
In this version of the laboratory (Acid-Base Titration II) you can perform the acid-base titration for an unknown acetic acid solution. In the other version of the laboratory (see Acid-Base Titration I) you can perform the acid-base titration for a citric acid solution instead.
This version of the laboratory emphasizes visual burette measurements, including properly reading the meniscus in the burette. The other version of the laboratory (see Acid-Base Titration I) does not emphasize this, and focuses on the calculations instead.
Also, in this version you can choose between two different configurations: one for the potentiometric approach and one for the colorimetric approach. The configuration for the colorimetric approach does not show the pH sensor. In the other version of the laboratory (see Acid-Base Titration I) there is a single configuration and the sensor is always shown.
Acid Base Titration III
Summary
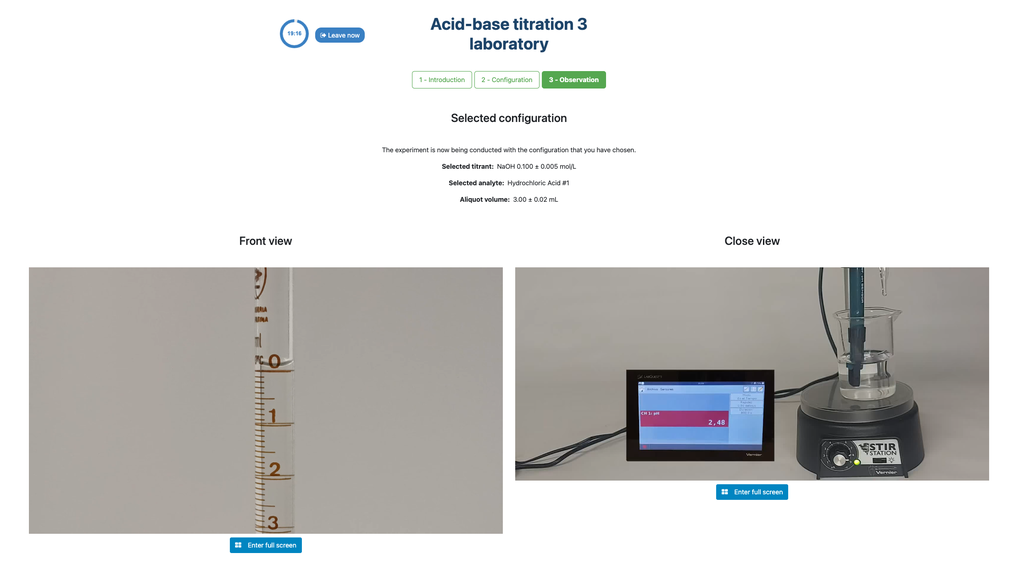
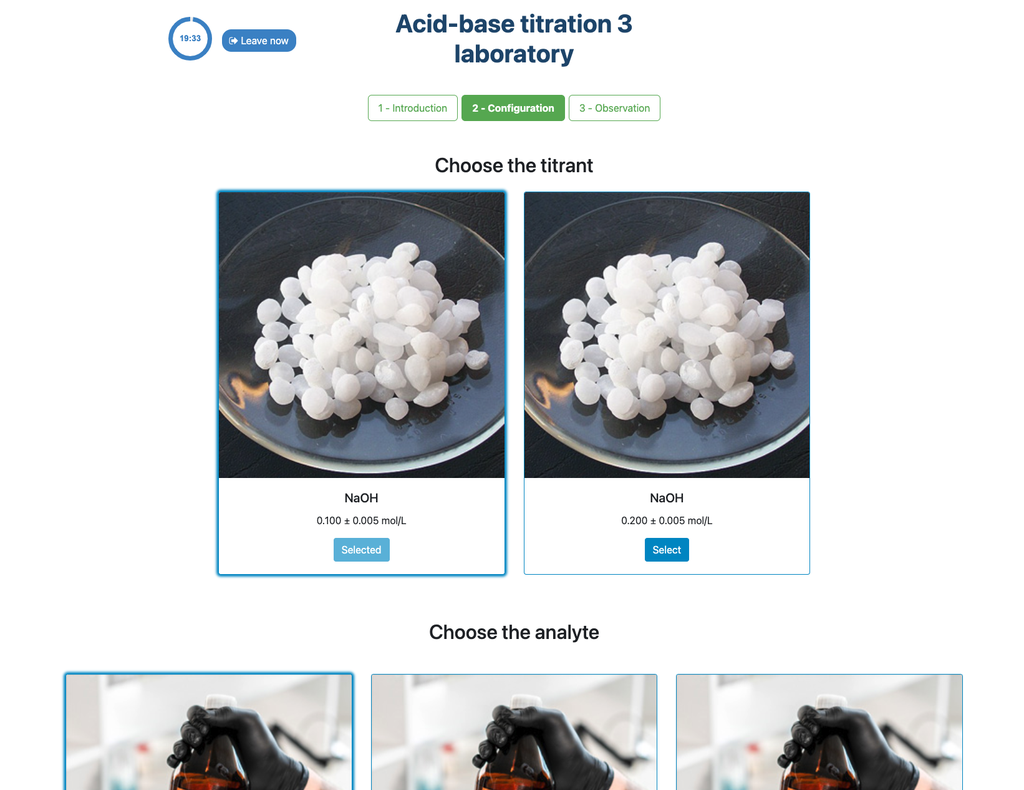
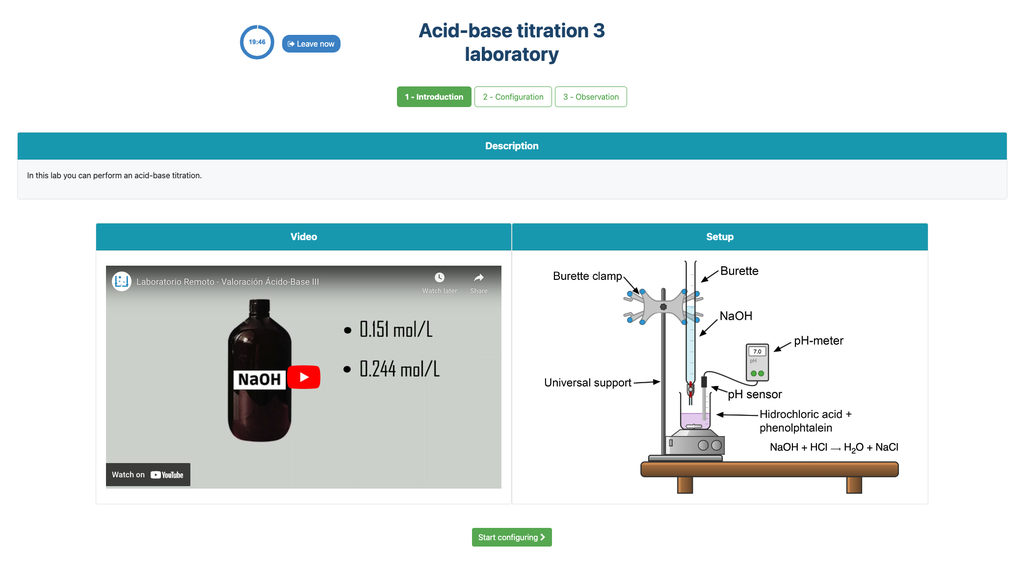
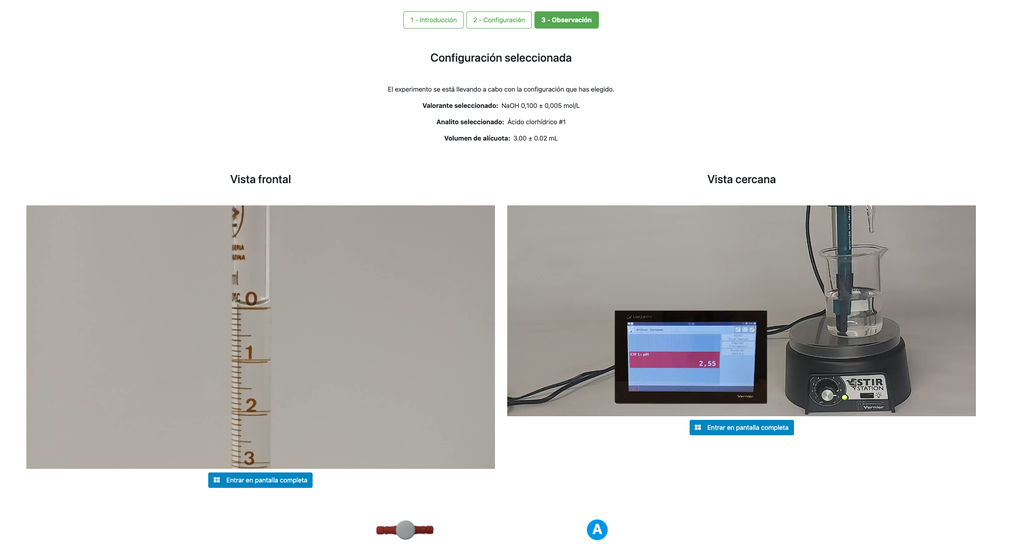
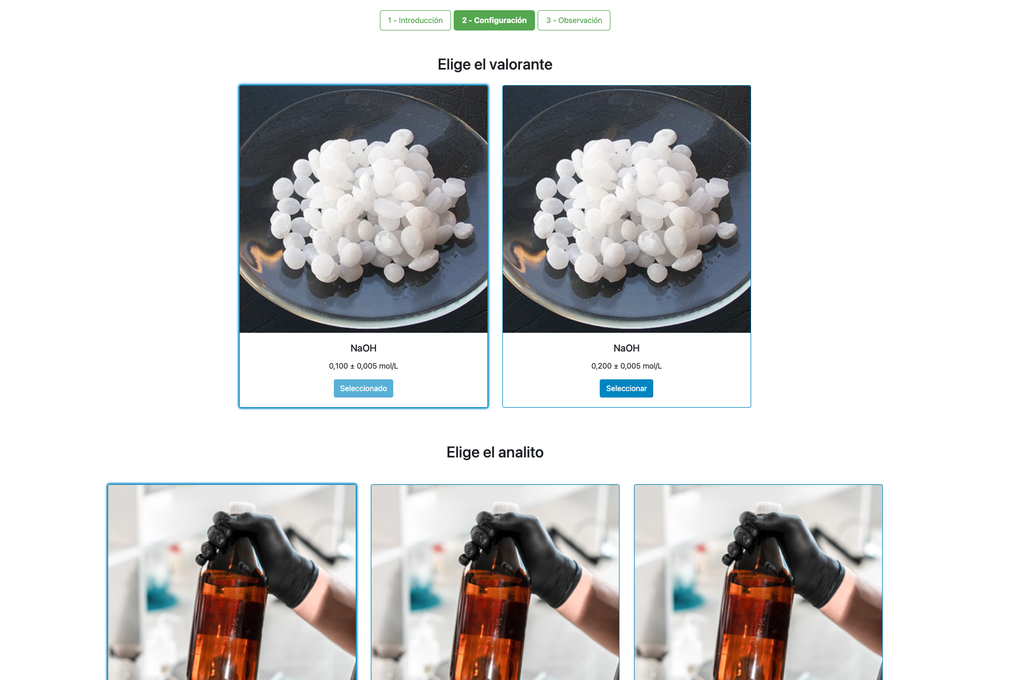
Perform an acid-base titration to determine the concentration of an unknown hydrochloric acid solution using a sodium hydroxide titrant. This laboratory emphasizes visual measurements dealing with the meniscus of the burette, and supports two different configurations.
The first one is for a potentiometric approach: you will have access to a digital pH sensor and you can use it to determine when the unknown solution has been neutralized.
The second one is for a colorimetric approach: you can rely on the color change due to the presence of a phenolphthalein indicator, without having a digital pH sensor available.
Acid-base Titration
Titrations are a volumetric method that is based on measuring the amount of a known-concentration reactive (known as a primary standard) that is consumed by an unknown-concentration sample known as analyte.
The titration is conducted by adding the titrant to the analyte using a burette, so as to obtain a chemically-equivalent substance between the titrant and the analyte. This is known as the "equivalence point" and it is a theoretical value that cannot be experimentally determined.
The experimental estimation of this point is obtained through an approximation known as "final point". This is determined through a physical change. In that case, the change in color of the solution is achieved after adding an indicator substance: a substance that changes color in certain ranges of pH.
For the acid-base titration we use a phenolphthalein indicator that becomes a light pink after a pH of around 8.4, which is a value that is very close to the equivalence point in the most common acid-base titrations.
Alternatively, in the potentiometric configuration, a digital pH sensor can be used to determine the “equivalence point”.
Colorimetric vs Potentiometric approach
The colorimetric approach relies on the color change provided by the phenolphthalein indicator. The potentiometric approach relies instead on the pH raise as measured by the digital sensor. In this version of the laboratory there are two different configurations available, one for each approach. In the colorimetric configuration students may not see the digital pH sensor.
Differences with the other titration laboratories
In this version of the laboratory (Acid-Base Titration II) you can perform the acid-base titration for an unknown hydrochloric acid solution. In other versions of the laboratory you can perform the acid-base titration for a citric acid solution instead (Acid-Base Titration I), and acetic acid (Acid-Base Titration II).
Both this version of the laboratory (Acid-Base Titration III) and Acid-Base Titration II emphasize visual burette measurements, including properly reading the meniscus in the burette. The other version of the laboratory (see Acid-Base Titration I) does not emphasize this, and focuses on the calculations instead.
Also, in these versions you can choose between two different configurations: one for the potentiometric approach and one for the colorimetric approach. The configuration for the colorimetric approach does not show the pH sensor. In other version of the laboratory (see Acid-Base Titration I) there is a single configuration and the sensor is always shown.

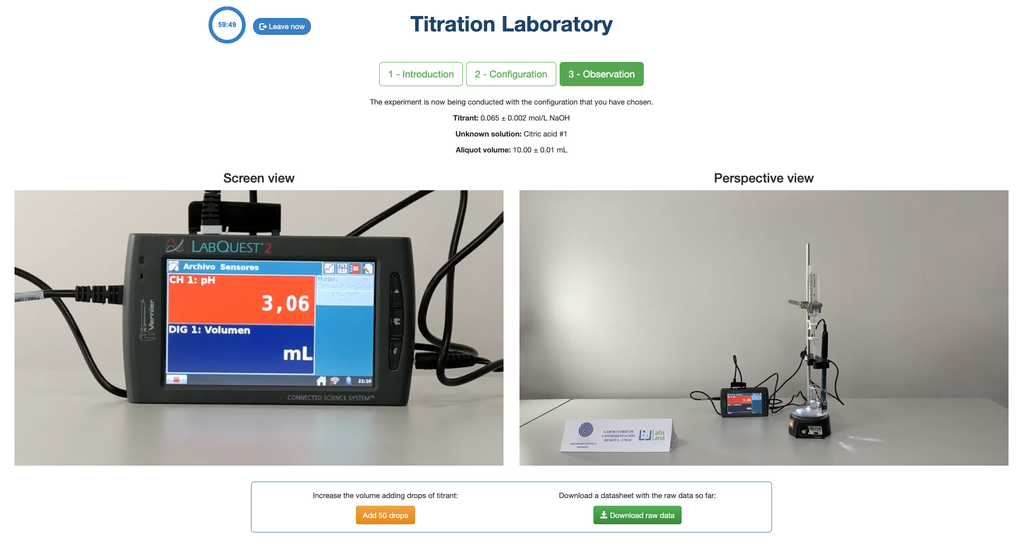
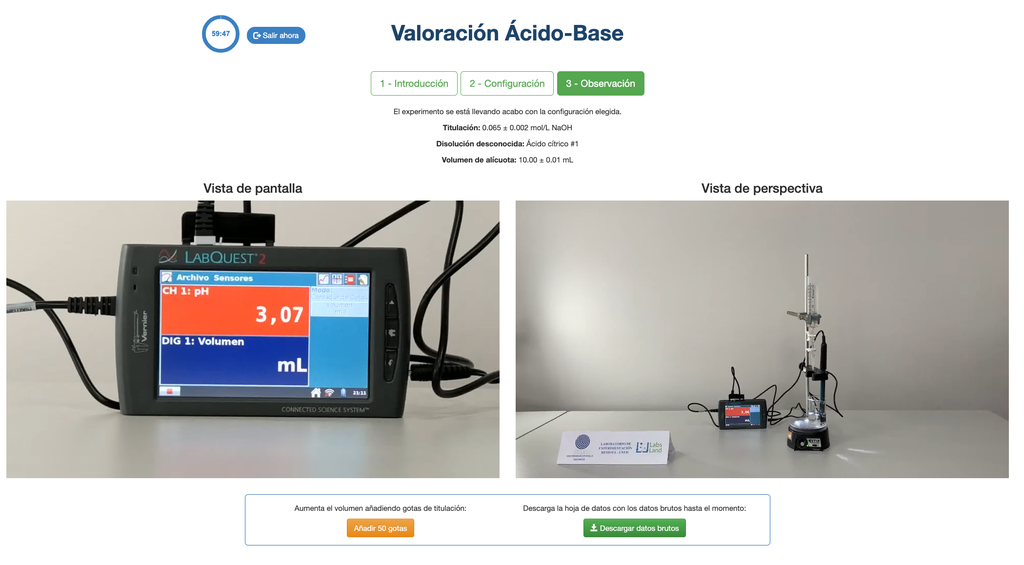
Acid-Base Titration I
Summary
Perform an acid-base titration to determine the concentration of an unknown citric acid solution using a sodium hydroxide titrant. A digital pH sensor is always available and a phenolphthalein indicator has been applied to the unknown solution so that both a potentiometric and colorimetric approach can be used. A real-time plot is also available.
Acid-Base Titration
Titrations are a volumetric method that is based on measuring the amount of a known-concentration reactive (known as a primary standard) that is consumed by an unknown-concentration sample known as analyte.
The titration is conducted by adding the titrant to the analyte using a burette, so as to obtain a chemically-equivalent substance between the titrant and the analyte. This is known as the "equivalence point" and it is a theoretical value that cannot be experimentally determined.
The experimental estimation of this point is obtained through an approximation known as "final point". This is determined through a physical change. In that case, the change in color of the solution is achieved after adding an indicator substance: a substance that changes color in certain ranges of pH.
For the acid-base titration we use a phenolphthalein indicator that becomes a light pink after a pH of around 8.4, which is a value that is very close to the equivalence point in the most common acid-base titrations.
Colorimetric vs Potentiometric approaches
The colorimetric approach relies on the color change provided by the phenolphthalein indicator. The potentiometric approach relies instead on the pH raise as measured by the digital sensor. In this version of the acid-base titration laboratory both approaches can be used. The digital sensor is always available and cannot be hidden.
Differences with the Acid-Base Titration II laboratory
In this version of the laboratory (Acid-Base Titration I) you can perform the acid-base titration for an unknown citric acid solution. In the other version of the laboratory (see Acid-Base Titration II) you can perform the acid-base titration for an acetic acid solution instead.
This version of the laboratory emphasizes the calculations but does not have visual burette measurements among its learning objectives. The other version of the laboratory (see Acid-Base Titration II) emphasizes visual measurements, and students must learn to read the meniscus of the burette properly.
Also, in this version there is a single experience that can be used for both the colorimetric and potentiometric approaches. In the other version of the laboratory (see Acid-Base Titration II) there are two different configurations available, in one of which the digital sensor is hidden so that students may only rely on the color change.
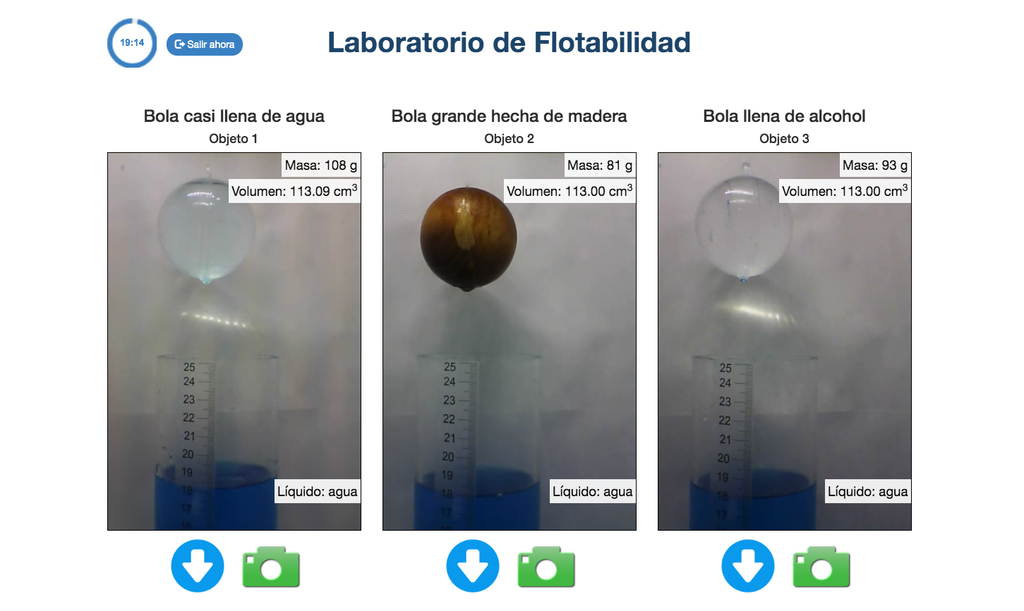
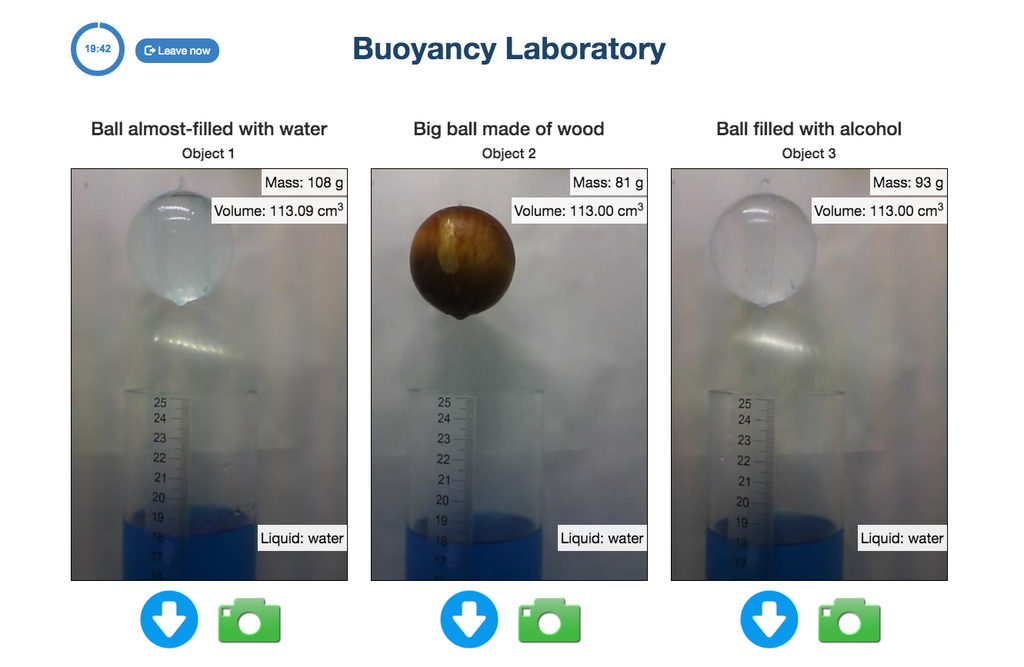
Advanced Buoyancy
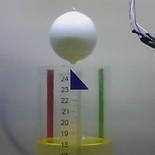
Experiment with buoyancy, the Principle of Archimedes, and similar physical laws. Take related measurements, conduct experiments, and start doing relatively advanced calculations to draw conclusions.
The experiments from the Advanced version of the Buoyancy laboratory will normally display more data (such as data from liquid level sensors and object weight sensors) and the proposed activities will involve numerical calculations of varying difficulty.
Boyle's Law
Summary
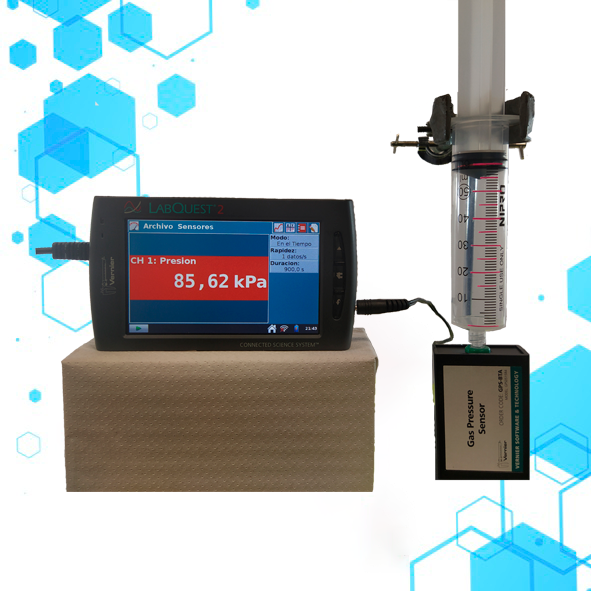
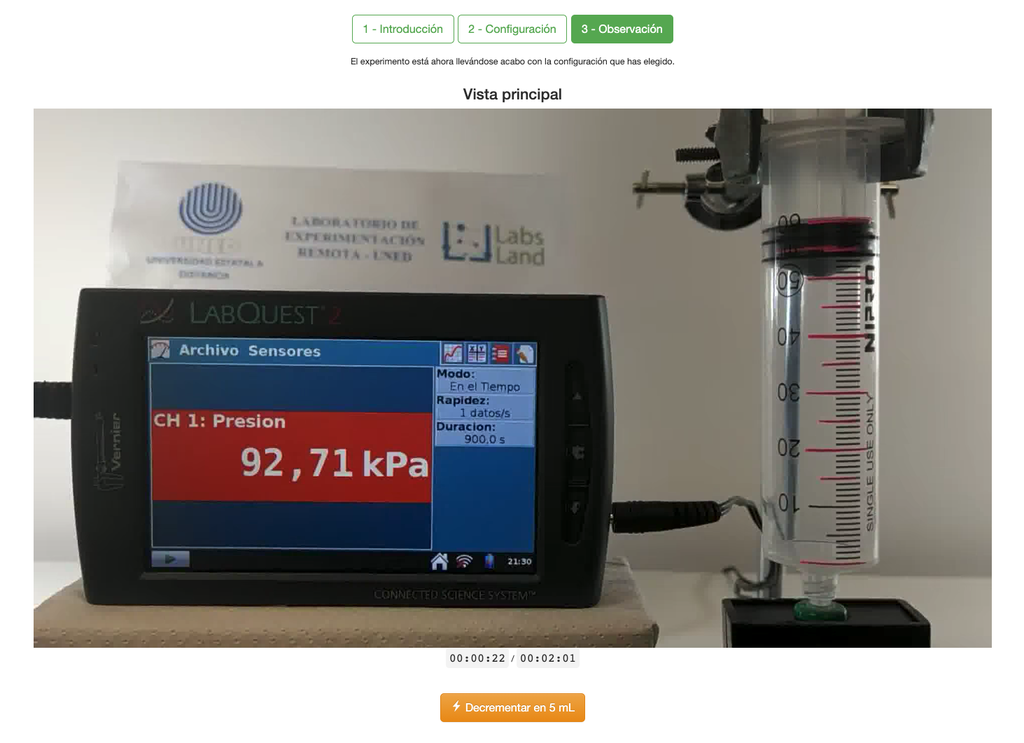
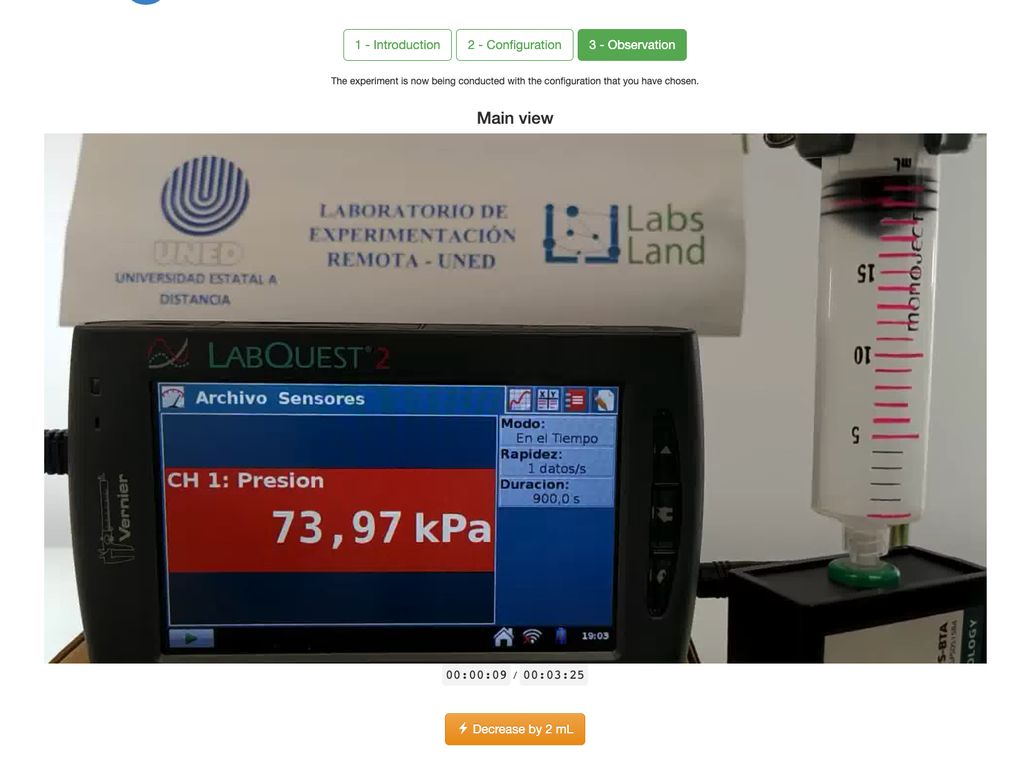
The Boyle's Law laboratory allows students to determine the relationship between the pressure and volume of a gas at ambient and constant temperature. Students can choose from two different volume syringes and measure the pressure of the gas as they reduce the volume. The experiment is reflected in a graphical analysis in the form of an isotherm. In this way, they can verify Boyle's Law and learn about the behavior of gases in a practical and accessible manner.
Boyle's Law
Boyle's Law states that at a constant temperature, the volume of a gas is inversely proportional to its pressure. This means that when the pressure of a gas increases, its volume decreases, and vice versa. Boyle's Law can be mathematically expressed as:
V ∝ 1/P
Where V is the volume of the gas and P is the pressure of the gas.
The Boyle's Law laboratory allows students to put this law into practice and verify it in an experimental context. By measuring the volume and pressure of the gas at different times, they can plot an isotherm graph that shows how the volume of the gas changes based on its pressure. If the isotherm graph fits Boyle's Law, then the students have experimentally verified the law.
Performing experiments like this is an excellent way to learn about the behavior of gases and how different variables are related. In addition, hands-on experiments can be more accessible and memorable for students than simply reading about the law in a textbook. The isotherm graph clearly visualizes the behavior of the gas and verifies if the predictions of Boyle's Law are met.
Application in Secondary and University Education
The Boyle's Law laboratory is typically applied in science courses at the high school level and in chemistry courses at the university level. At the high school level, the laboratory can be applied in a science course where the basic concepts of chemistry and physics, such as the pressure and volume of gases, are studied. At the university, the Boyle's Law laboratory can be applied in a more advanced chemistry course where the study of gases and their behavior is delved into.
Objectives
A Boyle's Law laboratory can have different educational objectives depending on the educational level at which it is applied. Here are some examples of objectives that a Boyle's Law laboratory can have at both high school and university levels:
At the high school level:
- Students understand Boyle's Law and its importance in gas physics.
- Students practice experimental and observational skills.
- Students develop data analysis and representation skills.
- Students understand the relationship between temperature, pressure, and volume of gases.
At the university level:
- Students know Boyle's Law and its importance in gas physics.
- Students demonstrate experimental and observational skills in the laboratory.
- Students apply theoretical concepts of gas physics in practical situations.
- Students develop data analysis and representation skills in a scientific context.
- Students understand how temperature, pressure, and volume of gases relate in different situations.
Cellular Respiration
Summary
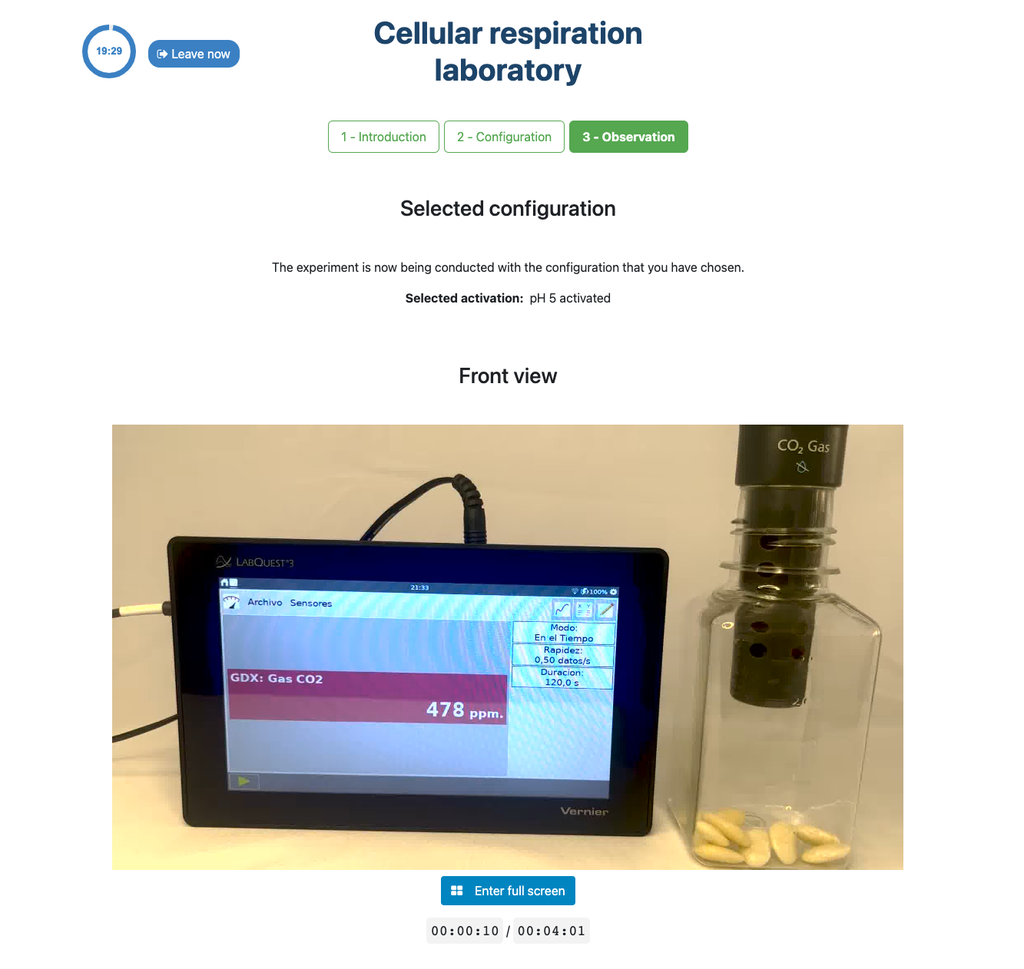
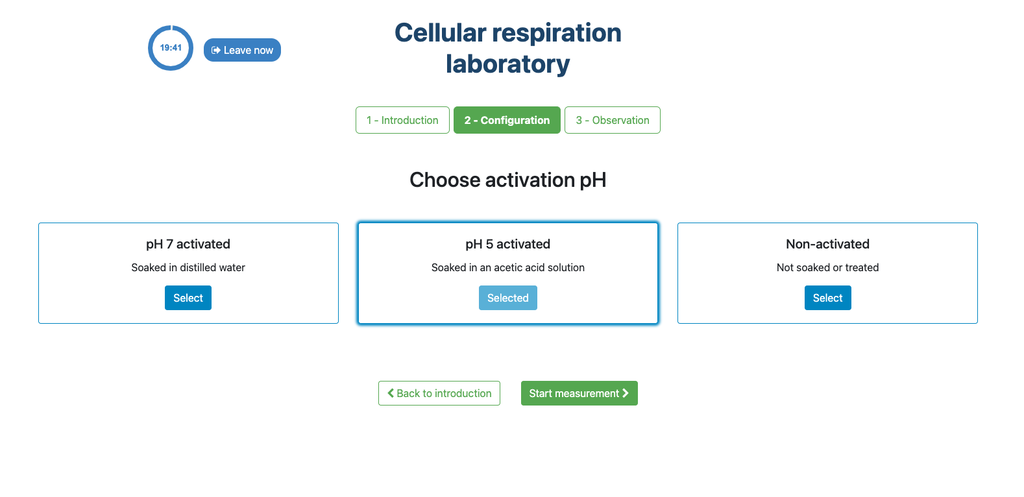
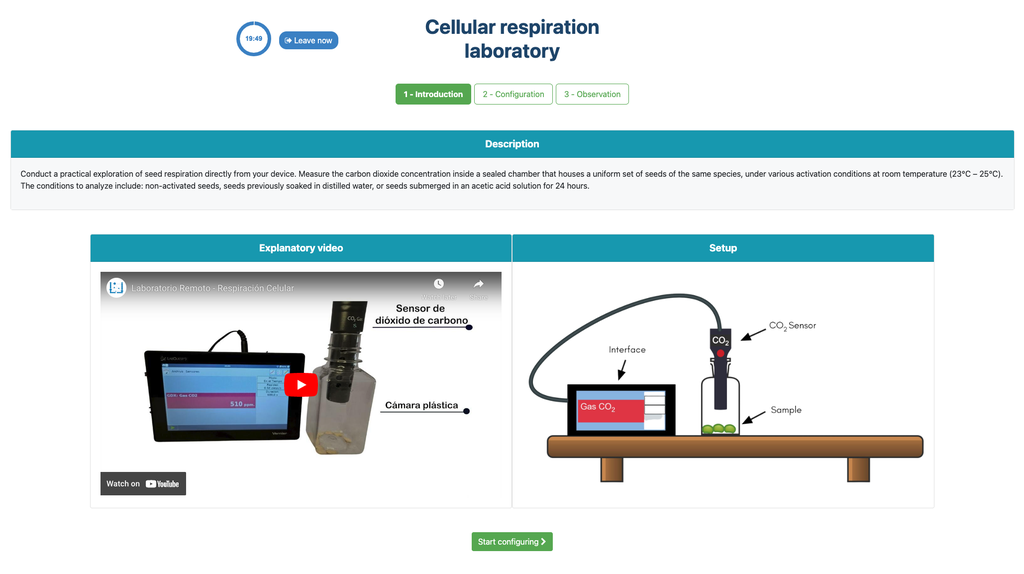
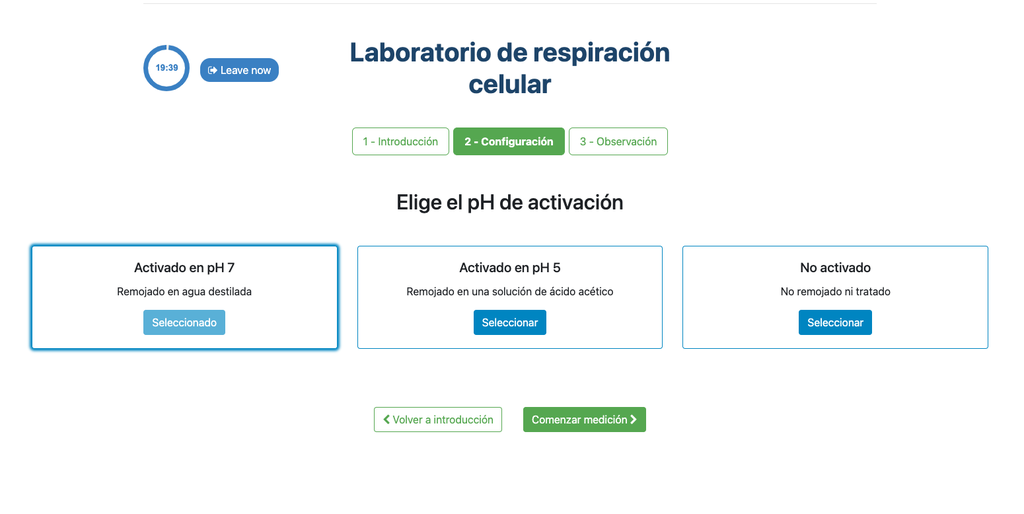
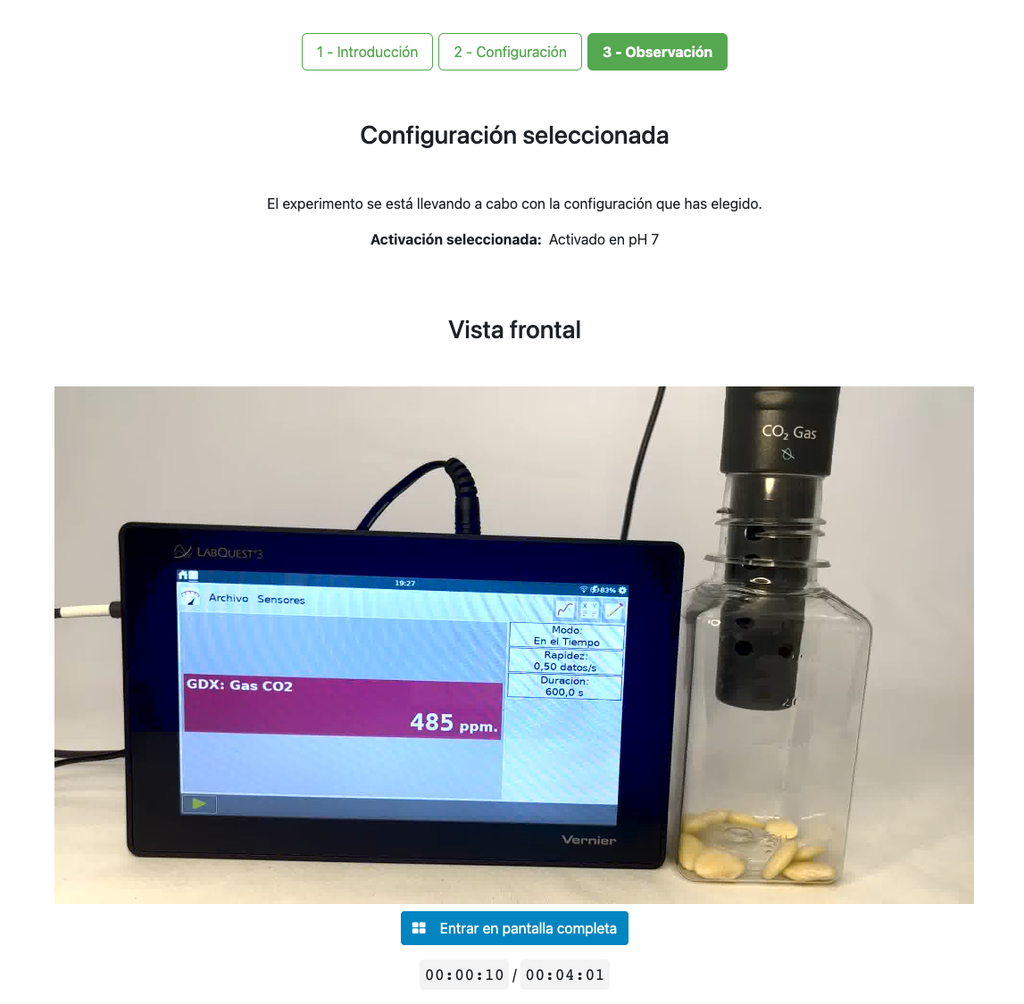
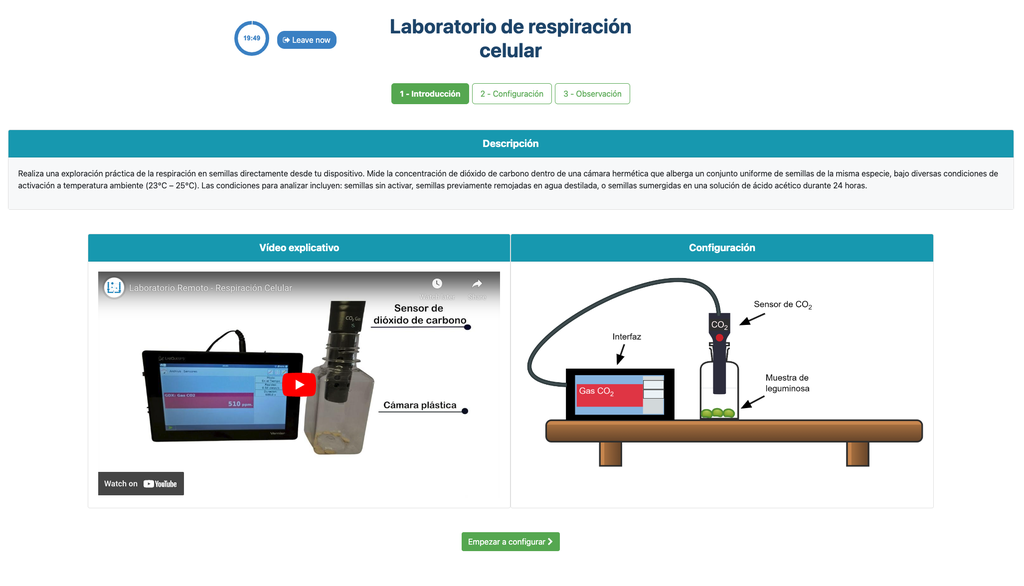
This laboratory setup allows students to measure the concentration of carbon dioxide inside a sealed chamber containing seeds of similar size to each other. Students can choose between different experimental conditions: seeds previously soaked in distilled water or in an acetic acid solution at room temperature (24 ± 1)°C, or unsoaked seeds (not activated).
Versions of this laboratory
In this version of the laboratory, students, in a manner similar to a traditional hands-on experiment, will need to collect data from the sensor readings and draw their own plots or create their own spreadsheets to analyze and draw conclusions, as it does not include any plots nor allows students to download data.
There is an alternative version of the laboratory (Cellular Respiration with Plot) in which a plot is displayed at the end of each experiment and students can download the data onto a spreadsheet.
Carbon dioxide release in plant respiration
Cellular respiration is one of the vital functions carried out by all cells, through which various organic compounds are broken down and the energy needed for other processes is released.
The exchange of gases at a macroscopic level is evidence of the energy transformation processes that occur in cells. In the presence of oxygen, carbon dioxide is released as a byproduct of cellular respiration. This emission of carbon dioxide is essential for understanding the metabolism of living beings and its consequences in ecosystems.
Seed Activation
The imbibition or absorption of water by seeds is an essential process for activating their metabolism and for breaking dormancy, thus preparing the seed for germination. This phenomenon occurs by immersing the seeds in water or aqueous solutions for a specified period, such as soaking in distilled water or acetic acid. The duration and conditions of imbibition directly influence the metabolic activation of the seed, which is reflected in the rate of carbon dioxide release during the cellular respiration process. The metabolic rate can vary depending on the species and chosen imbibition conditions.
Experiments & Setup
The experimental device is equipped with a gaseous carbon dioxide sensor and a hermetic chamber. Students have the option to select from the three previously detailed seed activation experimental conditions.
In all experiments, seeds of the same species with similar sizes are used, which facilitates the comparison of results.
Learning Objectives
- Understand the scientific endeavor through the development of a controlled experiment and the interpretation of data related to biological processes.
- Relate the release of carbon dioxide under different experimental conditions to cellular respiration, differentiating the levels of organization of matter.
- Identify cellular respiration as an essential characteristic of living beings and understand the importance of the energy transformations it entails.


Cellular Respiration (with plot)
Summary
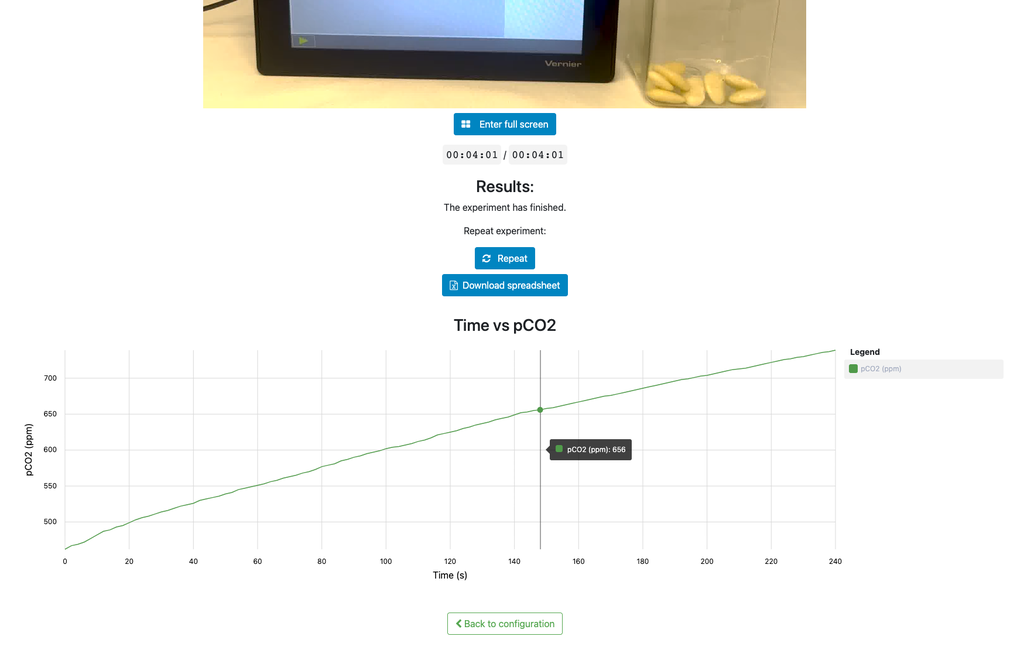
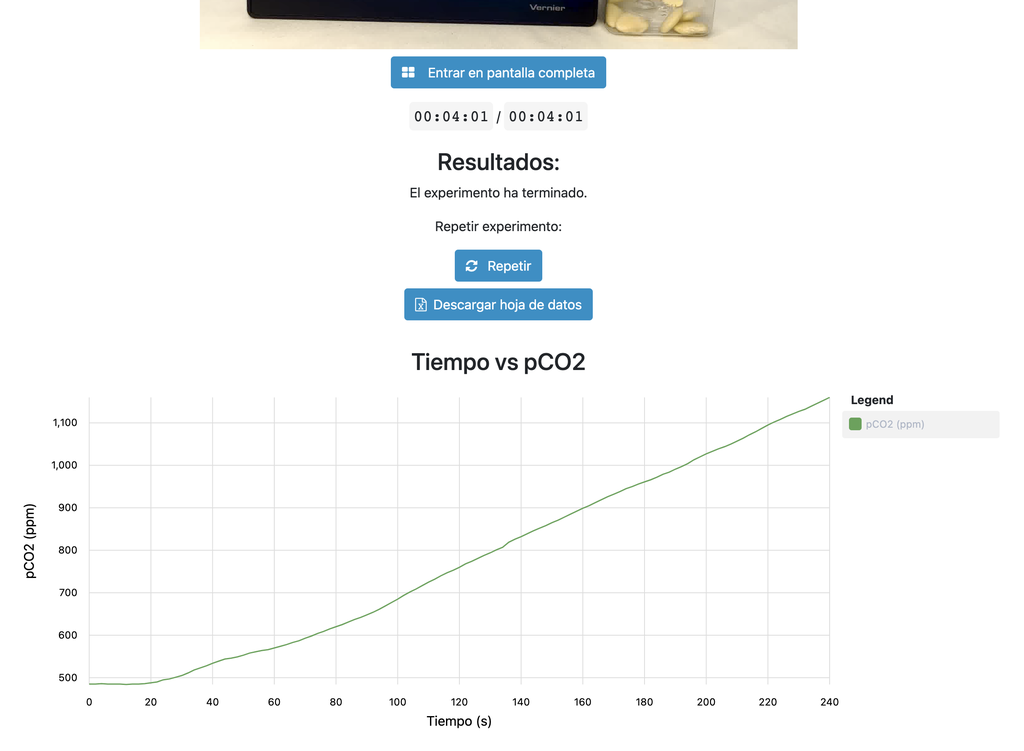
This laboratory setup allows students to measure the concentration of carbon dioxide inside a sealed chamber containing seeds of similar size to each other. Students can choose between different experimental conditions: seeds previously soaked in distilled water or in an acetic acid solution at room temperature (24 ± 1)°C, or unsoaked seeds (not activated).
Versions of this laboratory
This version of the laboratory displays a plot at the end of each experiment and allows students to download the data in a spreadsheet. This allows students to analyze the results without needing to gather and plot the data themselves.
An alternative version of the lab exists (Cellular Respiration) in which the plot and the data are not available. That way, in order to analyse the results and reach proper conclusions, students need to gather and plot the data themselves from the discrete sensor readings, similarly to how they would do so in a traditional hands-on lab.
Carbon dioxide release in plant respiration
Cellular respiration is one of the vital functions carried out by all cells, through which various organic compounds are broken down and the energy needed for other processes is released.
The exchange of gases at a macroscopic level is evidence of the energy transformation processes that occur in cells. In the presence of oxygen, carbon dioxide is released as a byproduct of cellular respiration. This emission of carbon dioxide is essential for understanding the metabolism of living beings and its consequences in ecosystems.
Seed Activation
The imbibition or absorption of water by seeds is an essential process for activating their metabolism and for breaking dormancy, thus preparing the seed for germination. This phenomenon occurs by immersing the seeds in water or aqueous solutions for a specified period, such as soaking in distilled water or acetic acid. The duration and conditions of imbibition directly influence the metabolic activation of the seed, which is reflected in the rate of carbon dioxide release during the cellular respiration process. The metabolic rate can vary depending on the species and chosen imbibition conditions.
Experiments & Setup
The experimental device is equipped with a gaseous carbon dioxide sensor and a hermetic chamber. Students have the option to select from the three previously detailed seed activation experimental conditions.
In all experiments, seeds of the same species with similar sizes are used, which facilitates the comparison of results.
Learning Objectives
- Understand the scientific endeavor through the development of a controlled experiment and the interpretation of data related to biological processes.
- Relate the release of carbon dioxide under different experimental conditions to cellular respiration, differentiating the levels of organization of matter.
- Identify cellular respiration as an essential characteristic of living beings and understand the importance of the energy transformations it entails.


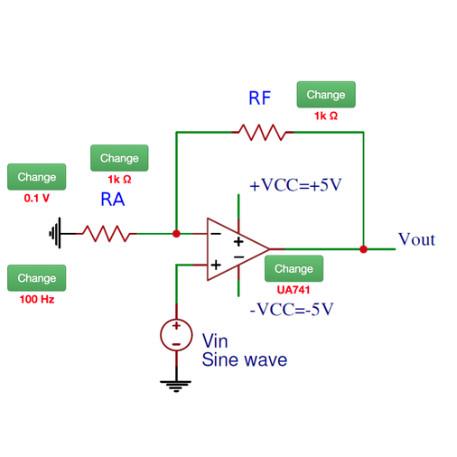
Common circuits
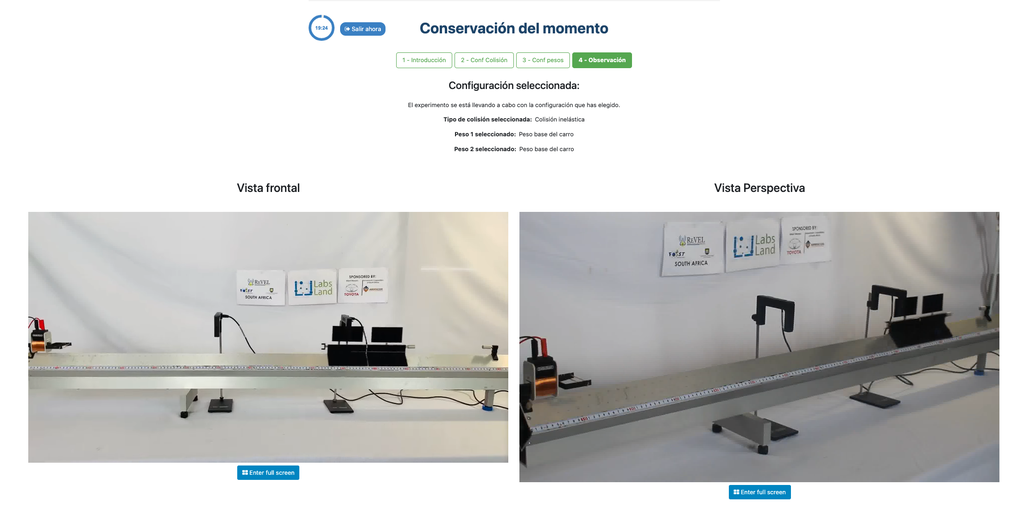
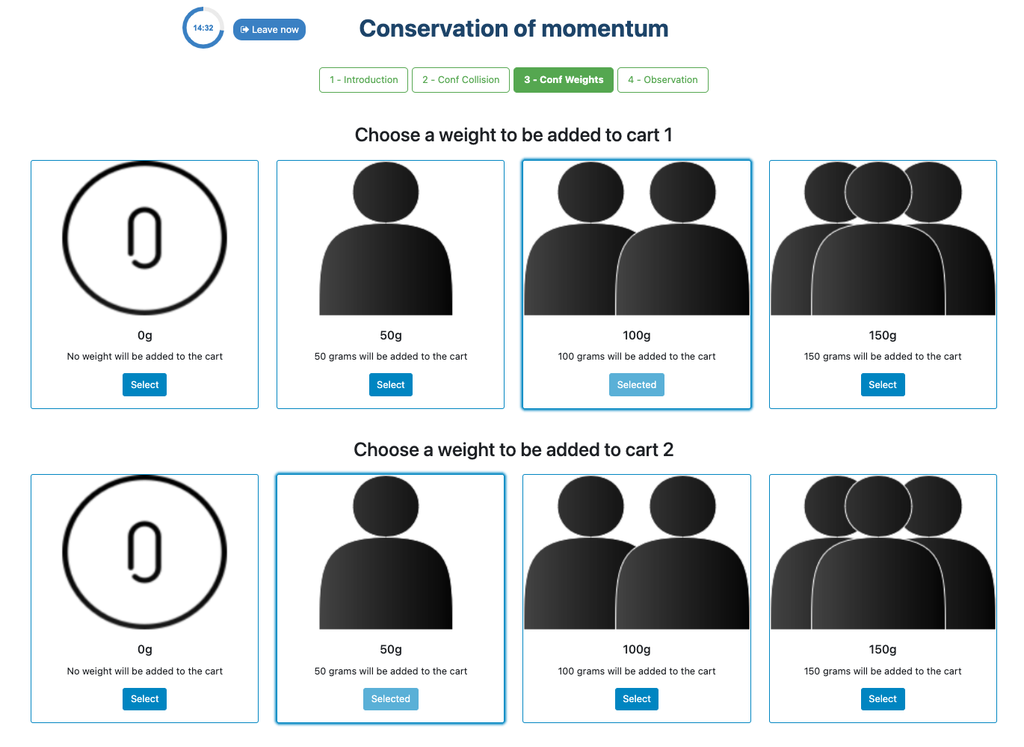
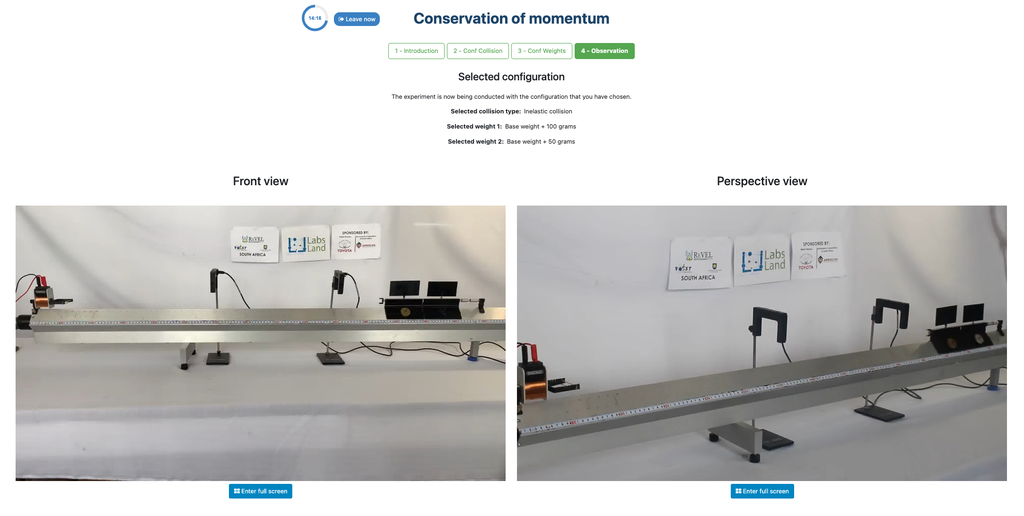
Conservation of Momentum
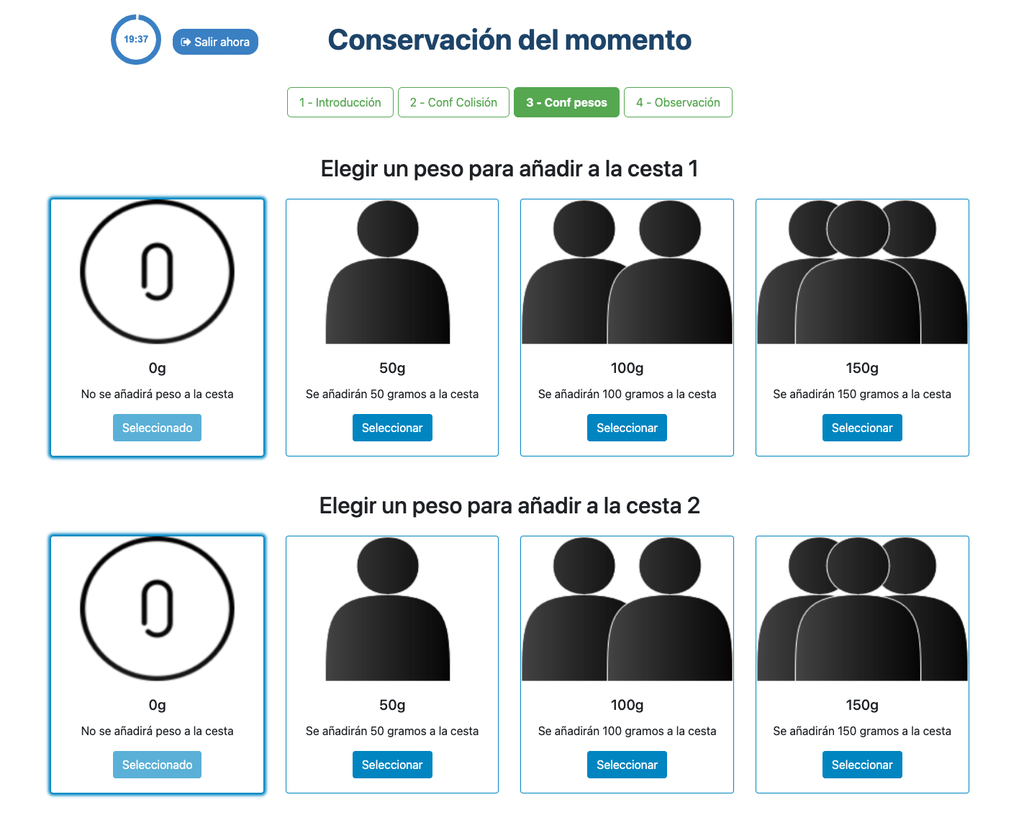
Conservation of Momentum is a law of physics that describes how momentum, which characterizes motion, does not change in an isolated collection of objects, and its total remains constant.
In this remote laboratory you will be able to make two carts collide in an elastic or inelastic collision, and varying certain experimental variables such as the mass of the carts. You will thus be able to experimentally test whether the total momentum changes or not after the collision.
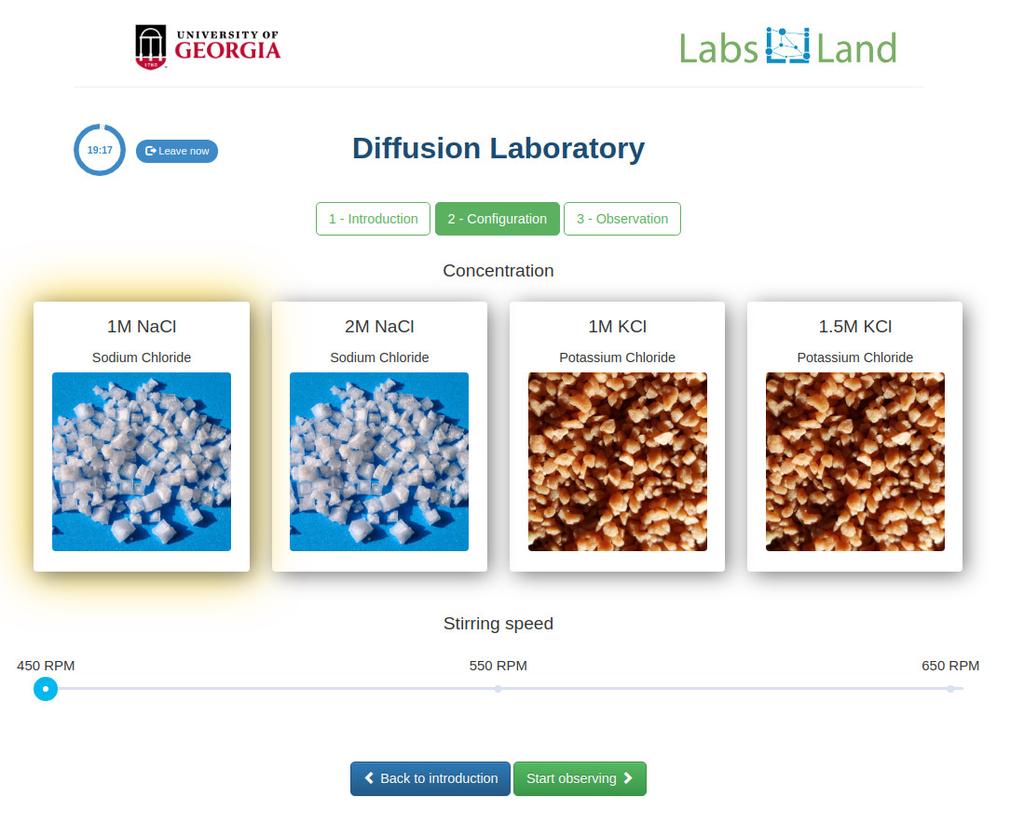
Diffusion laboratory - basic

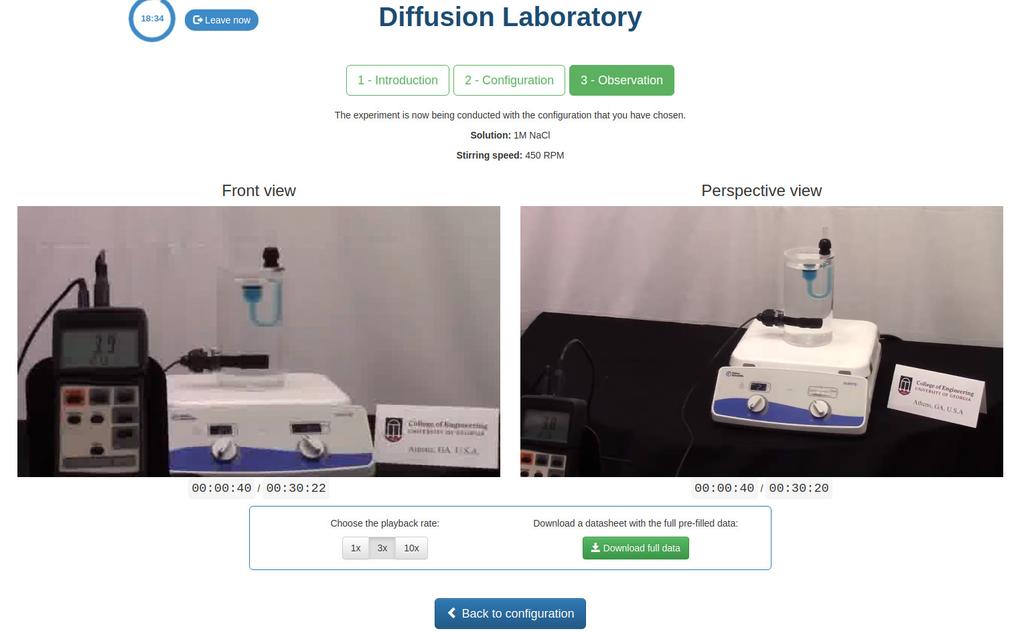
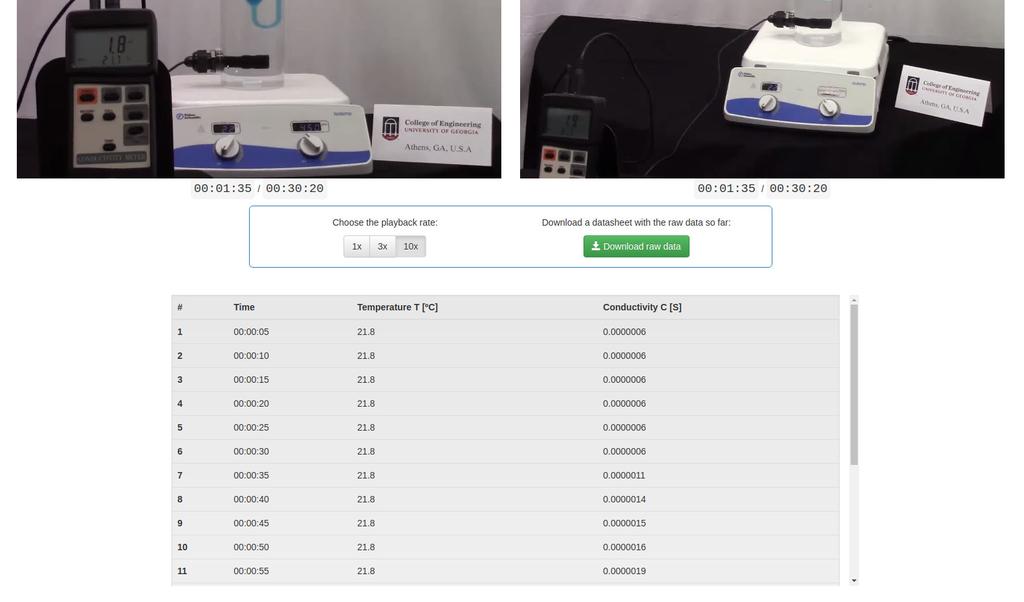
Diffusion laboratory - data

Diffusion laboratory - full
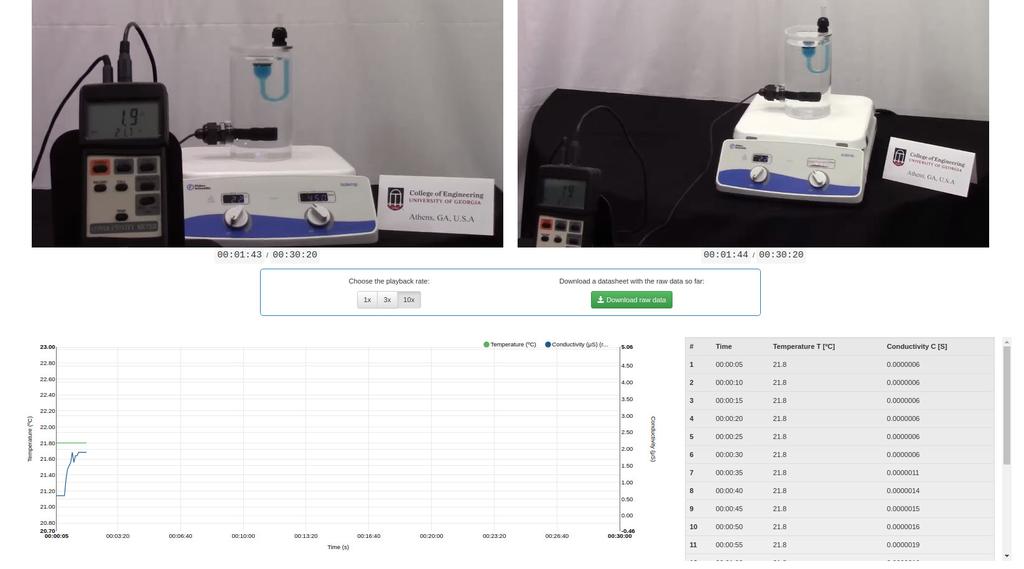
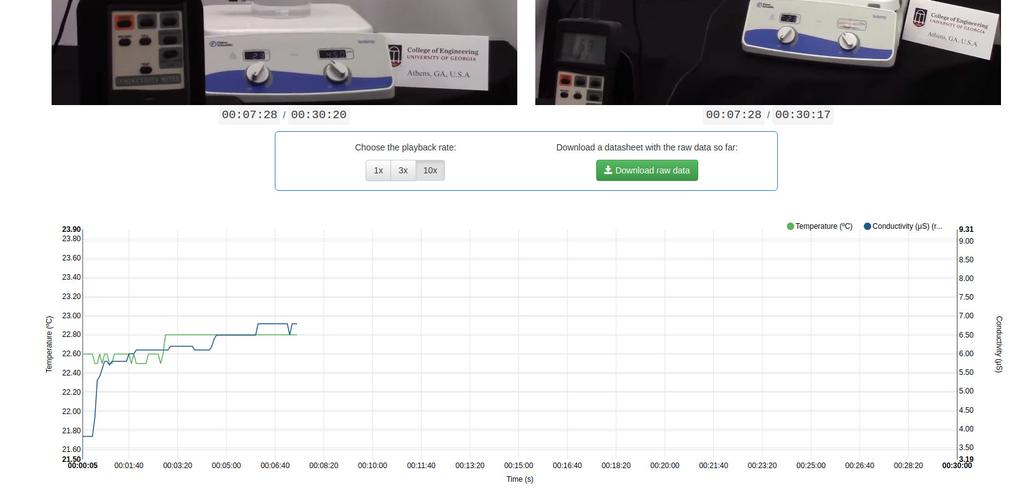
Diffusion laboratory - plot

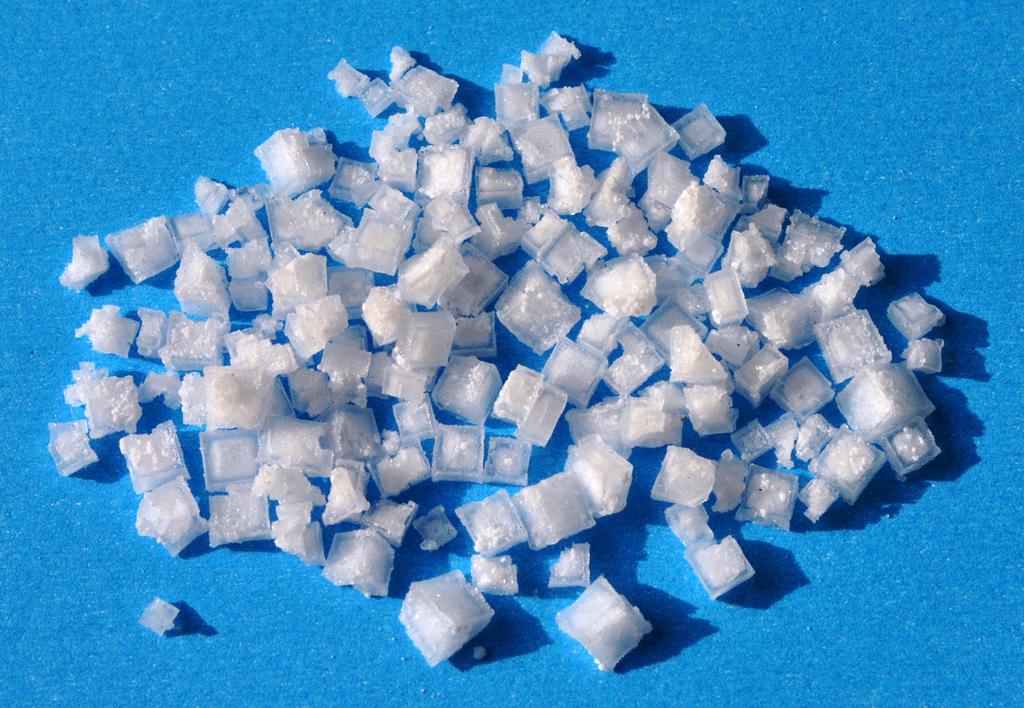
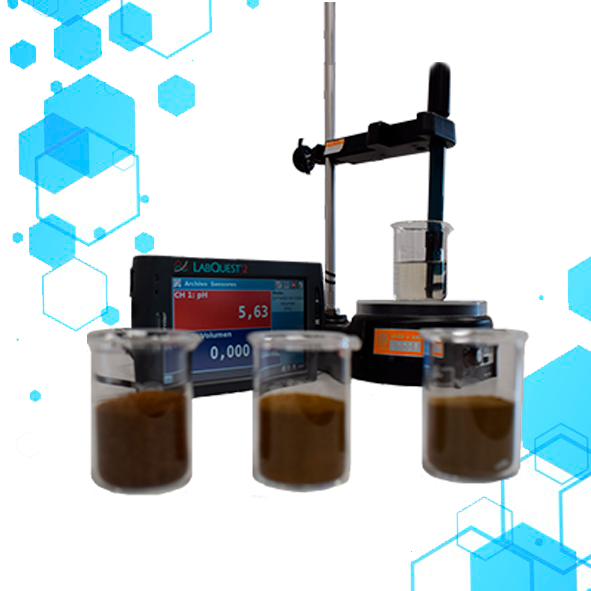
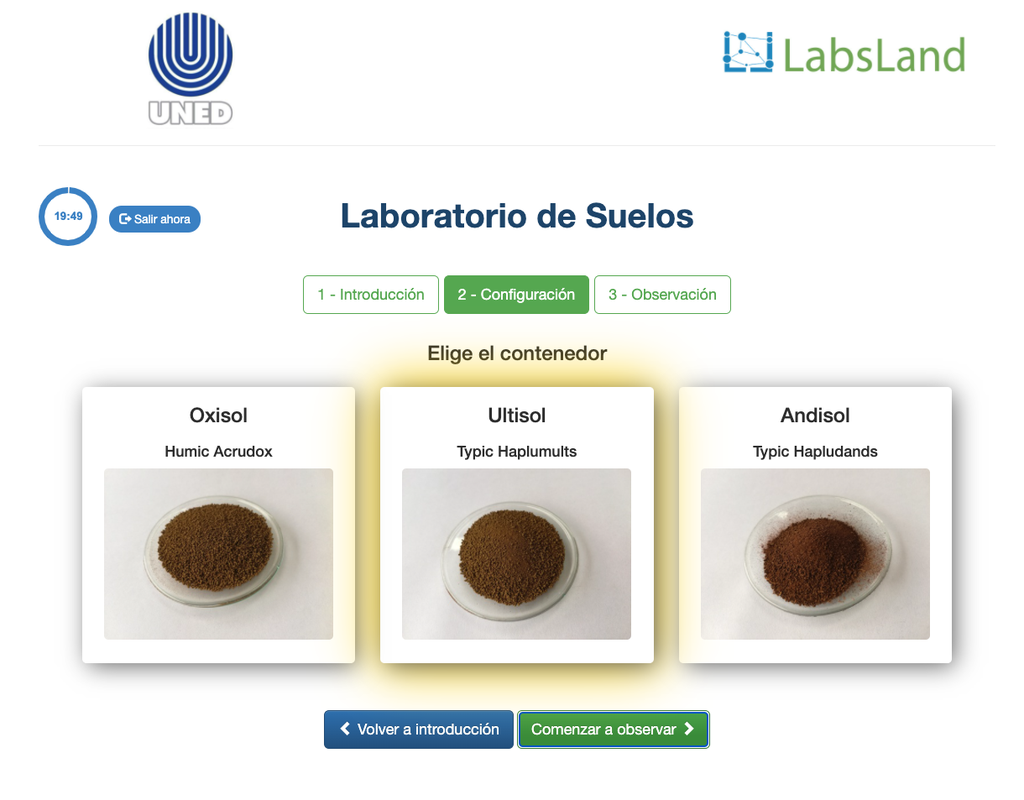
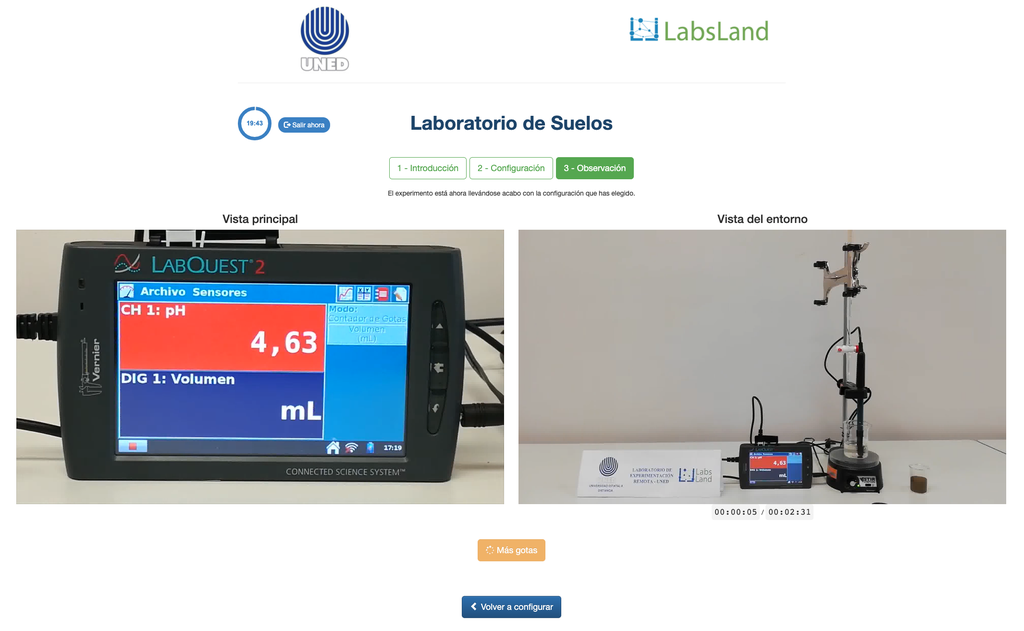
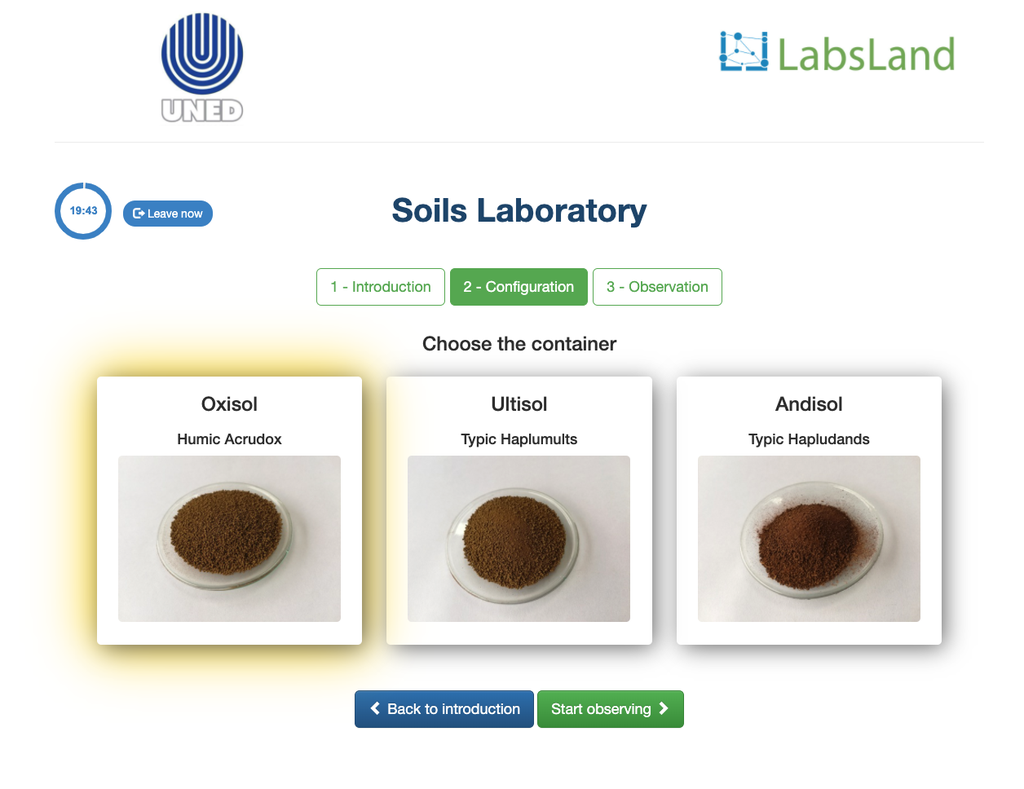
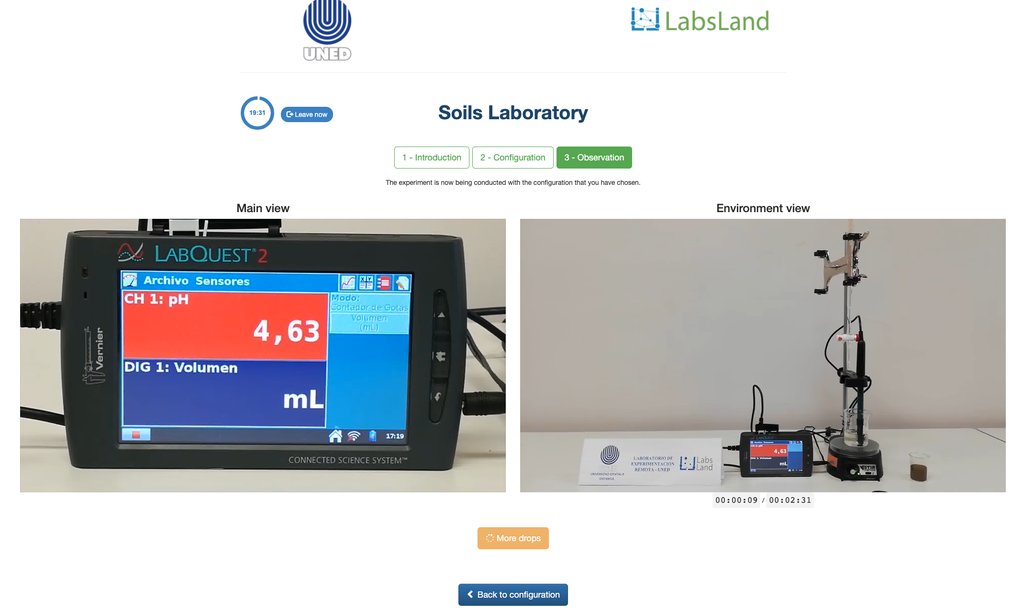
Exchangeable Acidity of Soils
The acidity of soils can occur due to various processes that promote a pH reduction. These processes occur naturally or by human action. The main sources of soil acidity are associated to hydrogen ions (H+) and aluminum ions (Al+3) in the soil's solution. Exchangeable acidity is determined through the use of neutral salts solutions such as potassium chloride (KCl). The acid ions (aluminum and hydronium) that are held in the colloidal fraction of the soil, that in the presence of a displacing ion (K+), makes those enter the soil solution. Afterward, that solution is titrated with a sodium hydroxide solution of the exact concentration to reach the last point of the neutralization reaction using phenolphthalein as an indicator.
Flowloop
Summary
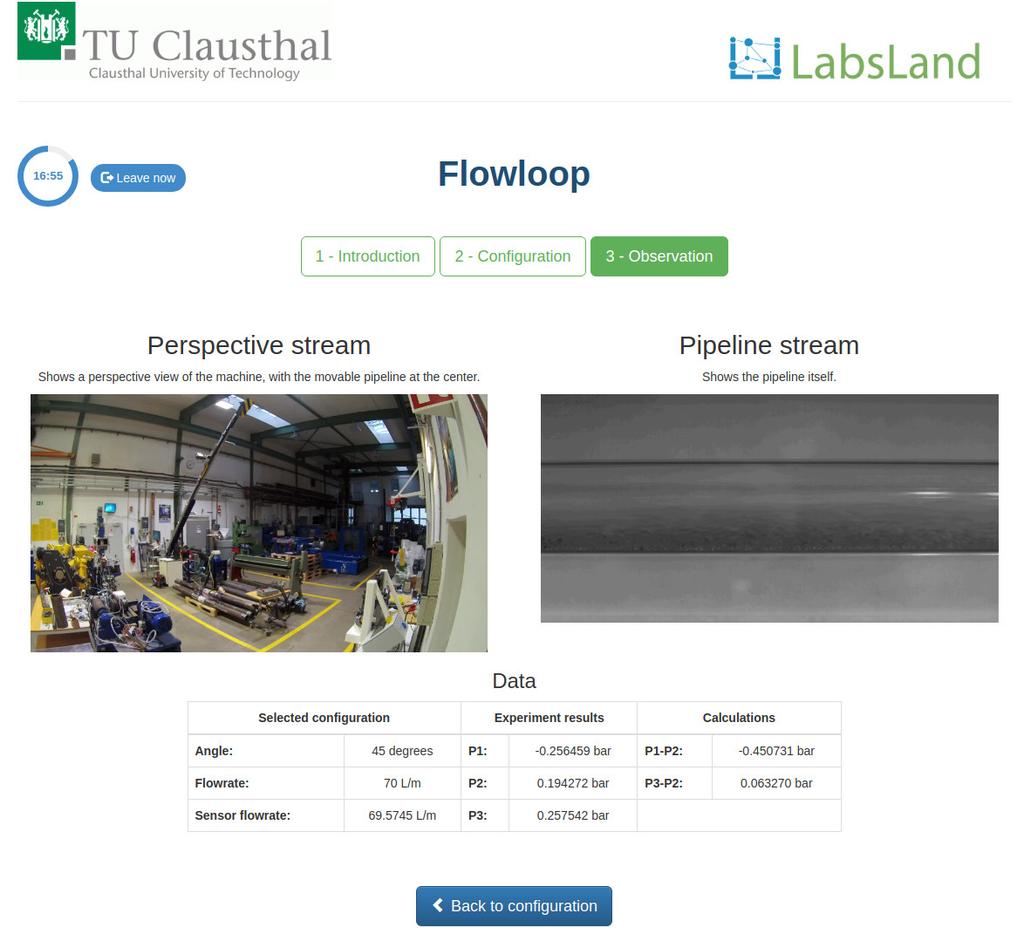
The Multi-Phase Flowloop laboratory lets you carry out experiments to visualize flow patterns of multi-phase systems that develop in production tubing in possible real-life scenarios. Through variation of the water flowrate and the angle of the tubing itself, you can appreciate the forming of different flow patterns or “cuttings” depending on the chosen values.
Further details
Multi-phase systems are found in various industrial scenarios, not being an exception the oil and gas industry. The prediction and determination of the flow pattern in the production tubing is of great importance since this is directly involved with the optimization of the production itself.
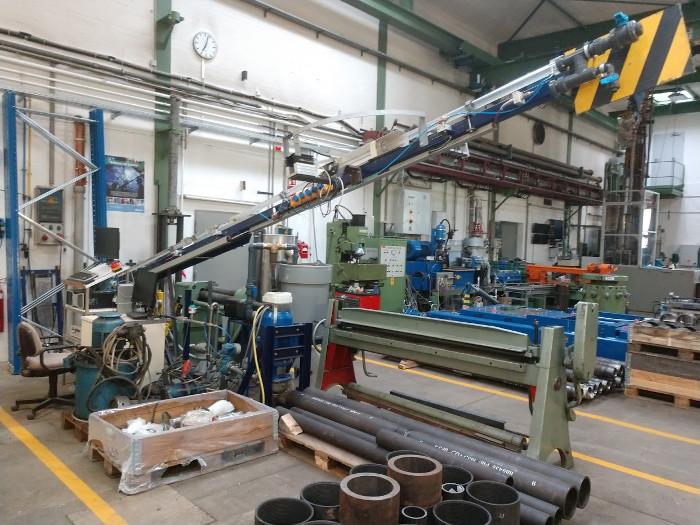
Mixtures of hydrocarbons, water, sediments and gases found in reservoirs manifest different behaviors during their transportation to the ground’s surface. Predicting such behaviors enable a better understanding for adequate choice of pumping machinery and pipeline setups for a successful transport to their final processing facility. The Multi-Phase Flowloop test unit helps achieving a better predictiveness of how multi-phase systems behave in real life for further investigation. This enables the user a better comprehension and visualization of how multi-phase transportations react under variable production rates and mixture proportions.
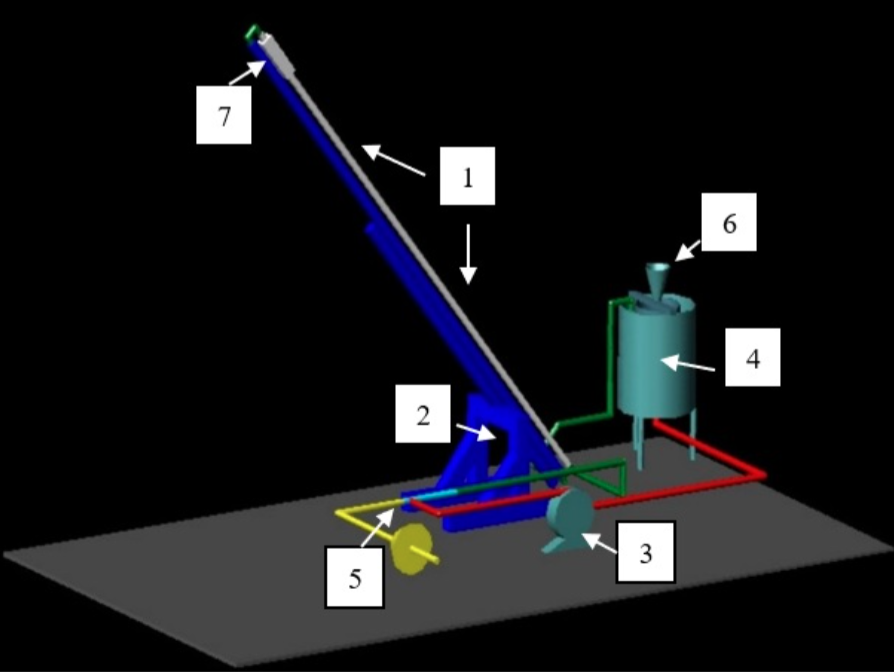
- The test section is a transparent 0.04m internal diameter straight Plexiglas pipeline (1) with a length of 6m.
- This pipe is supported by a hydraulic screw-jack (2) and a carbon steel beam, the system can be inclined up to an angle of 90 degrees from its horizontal ground level.
- A stainless-steel centrifugal pump (3) connected to the main tank (4) provides water to the system. Equipped with an electromagnetic induction flow meter and by the rotational speed of the pump, the rate of the water flow can be adjusted to the desired values.
- In order to develop various phase-flow patterns, air can be injected into the water stream via an air-water mixer (5).
- A hopper (6) fitted to the top of the water tank serves to feed another phase, representing the solid sediment
- A high-speed camera (7) mounted at the Plexiglas pipeline records the flow.
The Multi-Phase Flowloop laboratory lets you carry out experiments to visualize flow patterns of multi-phase systems that develop in production tubing in possible real-life scenarios. Through variation of the water flowrate and the angle of the tubing itself, you can appreciate the forming of different flow-patterns or “cuttings” depending on the chosen values.
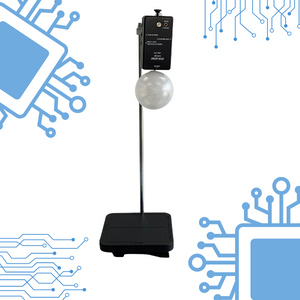
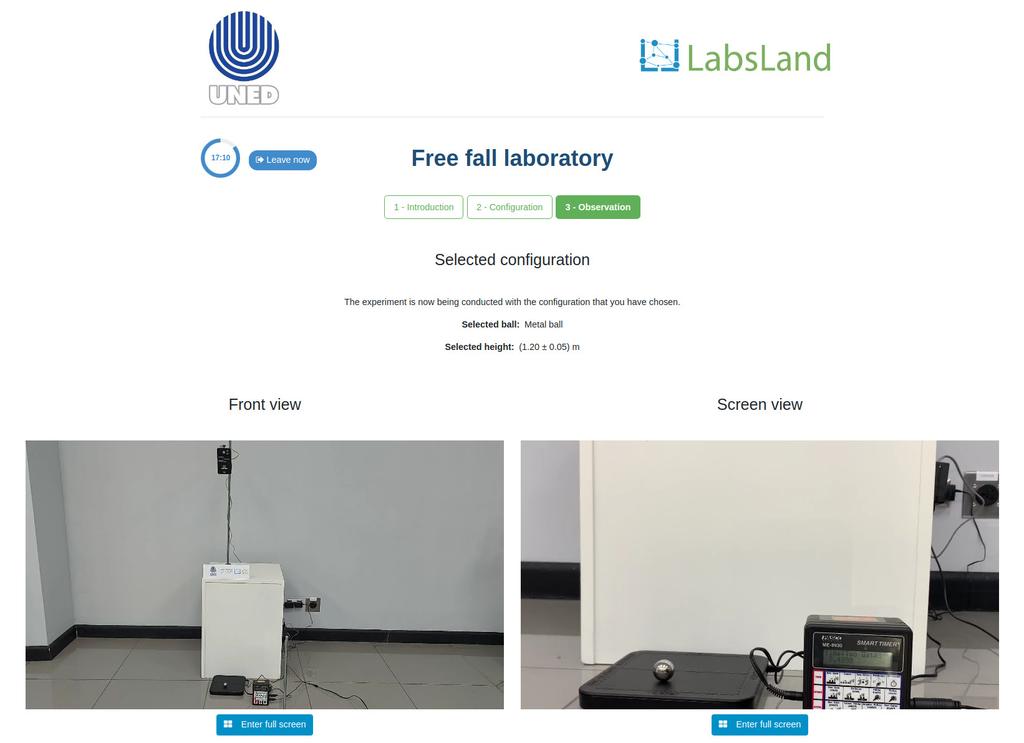
Free Fall
Summary
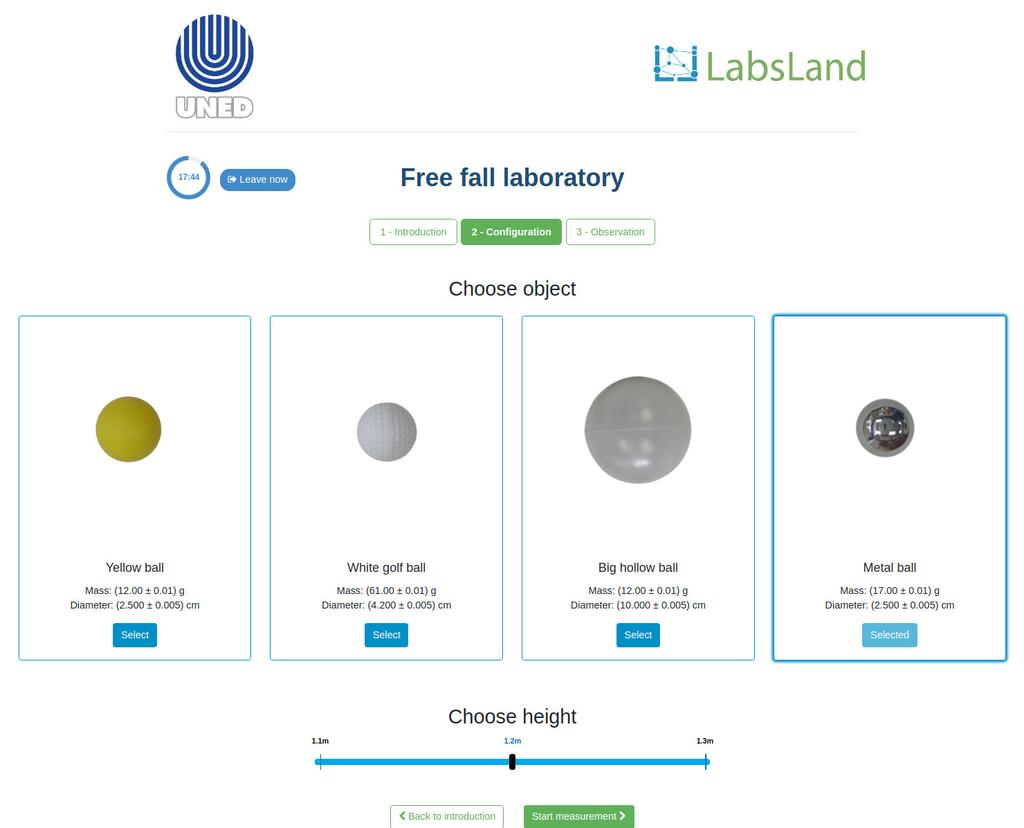
The remote laboratory offers a convenient way for schools and universities to conduct experiments on gravity and energy conservation. Students can choose from a variety of objects with different masses and release them using an electric switch. A receiving device will measure the time it takes for the object to fall, allowing students to experimentally calculate gravity and conduct other experiments related to free-falling objects. The laboratory offers activities for varying levels, making it suitable for students of all abilities. By using the remote laboratory, students can gain a deeper understanding of these fundamental concepts in physics.
Free-fall
Free-fall is a phenomenon that occurs when an object falls under the influence of gravity alone. This can be observed by dropping an object from a certain height and watching it accelerate towards the ground at a constant rate. In schools and universities, free-fall experiments are commonly used to help students understand and explore the fundamental concepts of gravity and energy conservation. These experiments typically involve releasing an object from a known height and using a receiving device to measure its time of fall, allowing students to calculate the acceleration due to gravity and conduct other experiments related to free-falling objects. By conducting these experiments, students can gain a deeper understanding of the physical principles that govern free-fall and how they apply to real-world situations.
In a free-fall experiment, students can carefully measure the initial height of the falling object and the time it takes to reach the ground, allowing them to calculate the acceleration due to gravity. Students can also experiment with different objects of varying masses to see how the acceleration due to gravity changes based on the mass of the object. In addition to helping students understand the basic principles of gravity and energy conservation, free-fall experiments can also be used to explore more advanced concepts in physics. For example, students can experiment with objects that have different shapes and densities to see how these factors affect the rate of free-fall. They can also use the results of their experiments to make predictions about the motion of objects in real-world situations, such as the motion of a skydiver or a satellite in orbit around the Earth. Overall, free-fall experiments are an engaging and effective way for students to learn about the fundamental principles of physics.
Incorporation in Physics & Physical Science courses
Free fall experiments are typically included in courses at both the university and school level that focus on physics and physical science. At the university level, free fall experiments are often included in introductory physics courses, as well as in more advanced courses that focus on mechanics, gravitation, and other related topics. At the school level, free fall experiments are often included in middle and high school physical science courses, where they can help students develop an understanding of key physical science concepts and principles, such as forces, motion, energy, and momentum. These experiments may also be included in more advanced courses, such as high school physics or college-level physics courses for non-physics majors.
Typical learning objectives
The typical learning objectives of a free-fall laboratory for the school and university level are as follows:
- Develop an understanding of key physical science concepts and principles, such as forces, motion, energy, and momentum. Free fall is a key concept in the study of motion and the effects of gravity, and is related to these physical science concepts and principles.
- Apply physical science concepts and principles to real-world situations using laboratory equipment and facilities. The concept of free fall is relevant to a wide range of real-world situations, and can be studied using laboratory equipment and facilities.
- Gain hands-on experience with conducting experiments and analyzing data, using specialized equipment and facilities. Free-fall experiments can provide students with hands-on experience with conducting experiments and analyzing data.
- Learn how to design and conduct experiments using laboratory equipment and facilities. Free-fall experiments can help students learn how to design and conduct experiments.
- Learn how to control variables and collect data, using specialized equipment and facilities. In free-fall experiments, students can learn how to control variables and collect data.
- Use data collected to draw conclusions and make predictions. Data collected from free-fall experiments can be used to draw conclusions and make predictions about the effects of gravity on the motion of objects.
- Develop critical thinking and problem-solving skills through the use of laboratory equipment and facilities. Free-fall experiments can help students develop critical thinking and problem-solving skills.
- Appreciate the importance of scientific inquiry and the scientific method, and the role of technology in advancing scientific knowledge. Free-fall experiments can help students appreciate the importance of scientific inquiry and the role of technology in advancing scientific knowledge.
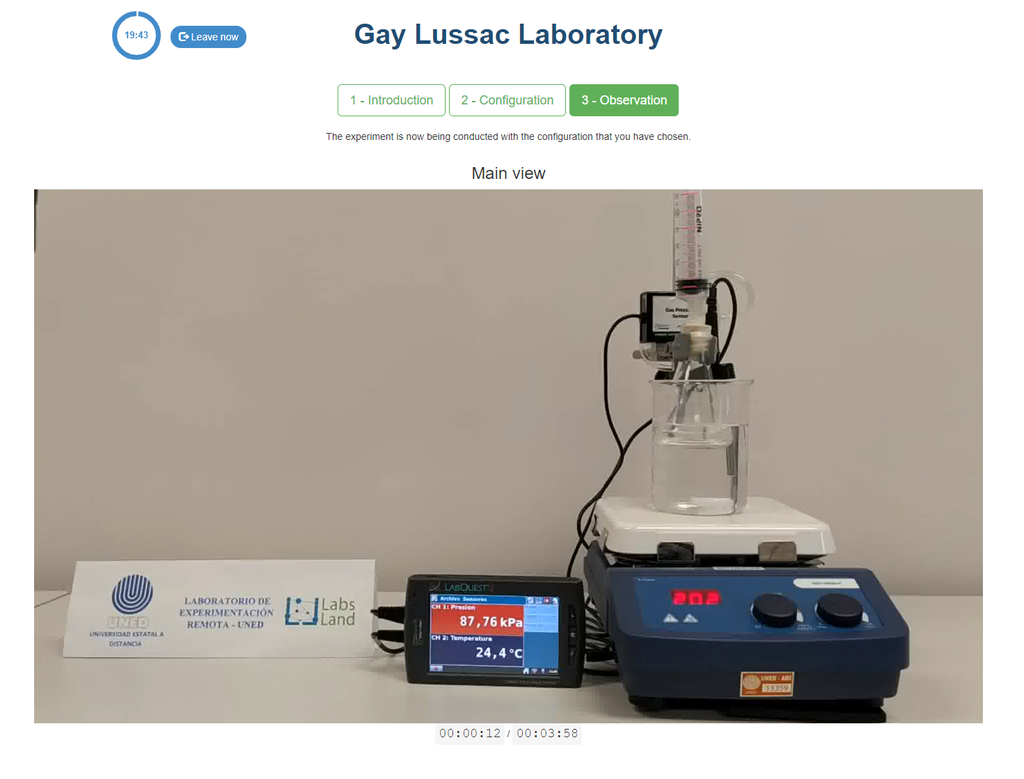
Gay-Lussac's Law
Gay-Lussac's law allows us to study the behavior of gases and is often studied in physics and chemistry. It relates the pressure of a gas with its temperature, while other parameters such as volume and amount remain constant.
There are various way to verify Gay-Lussac's law. In this experiment we will verify that, for a given amount of the gas, the pressure is directly proportional to the temperature.

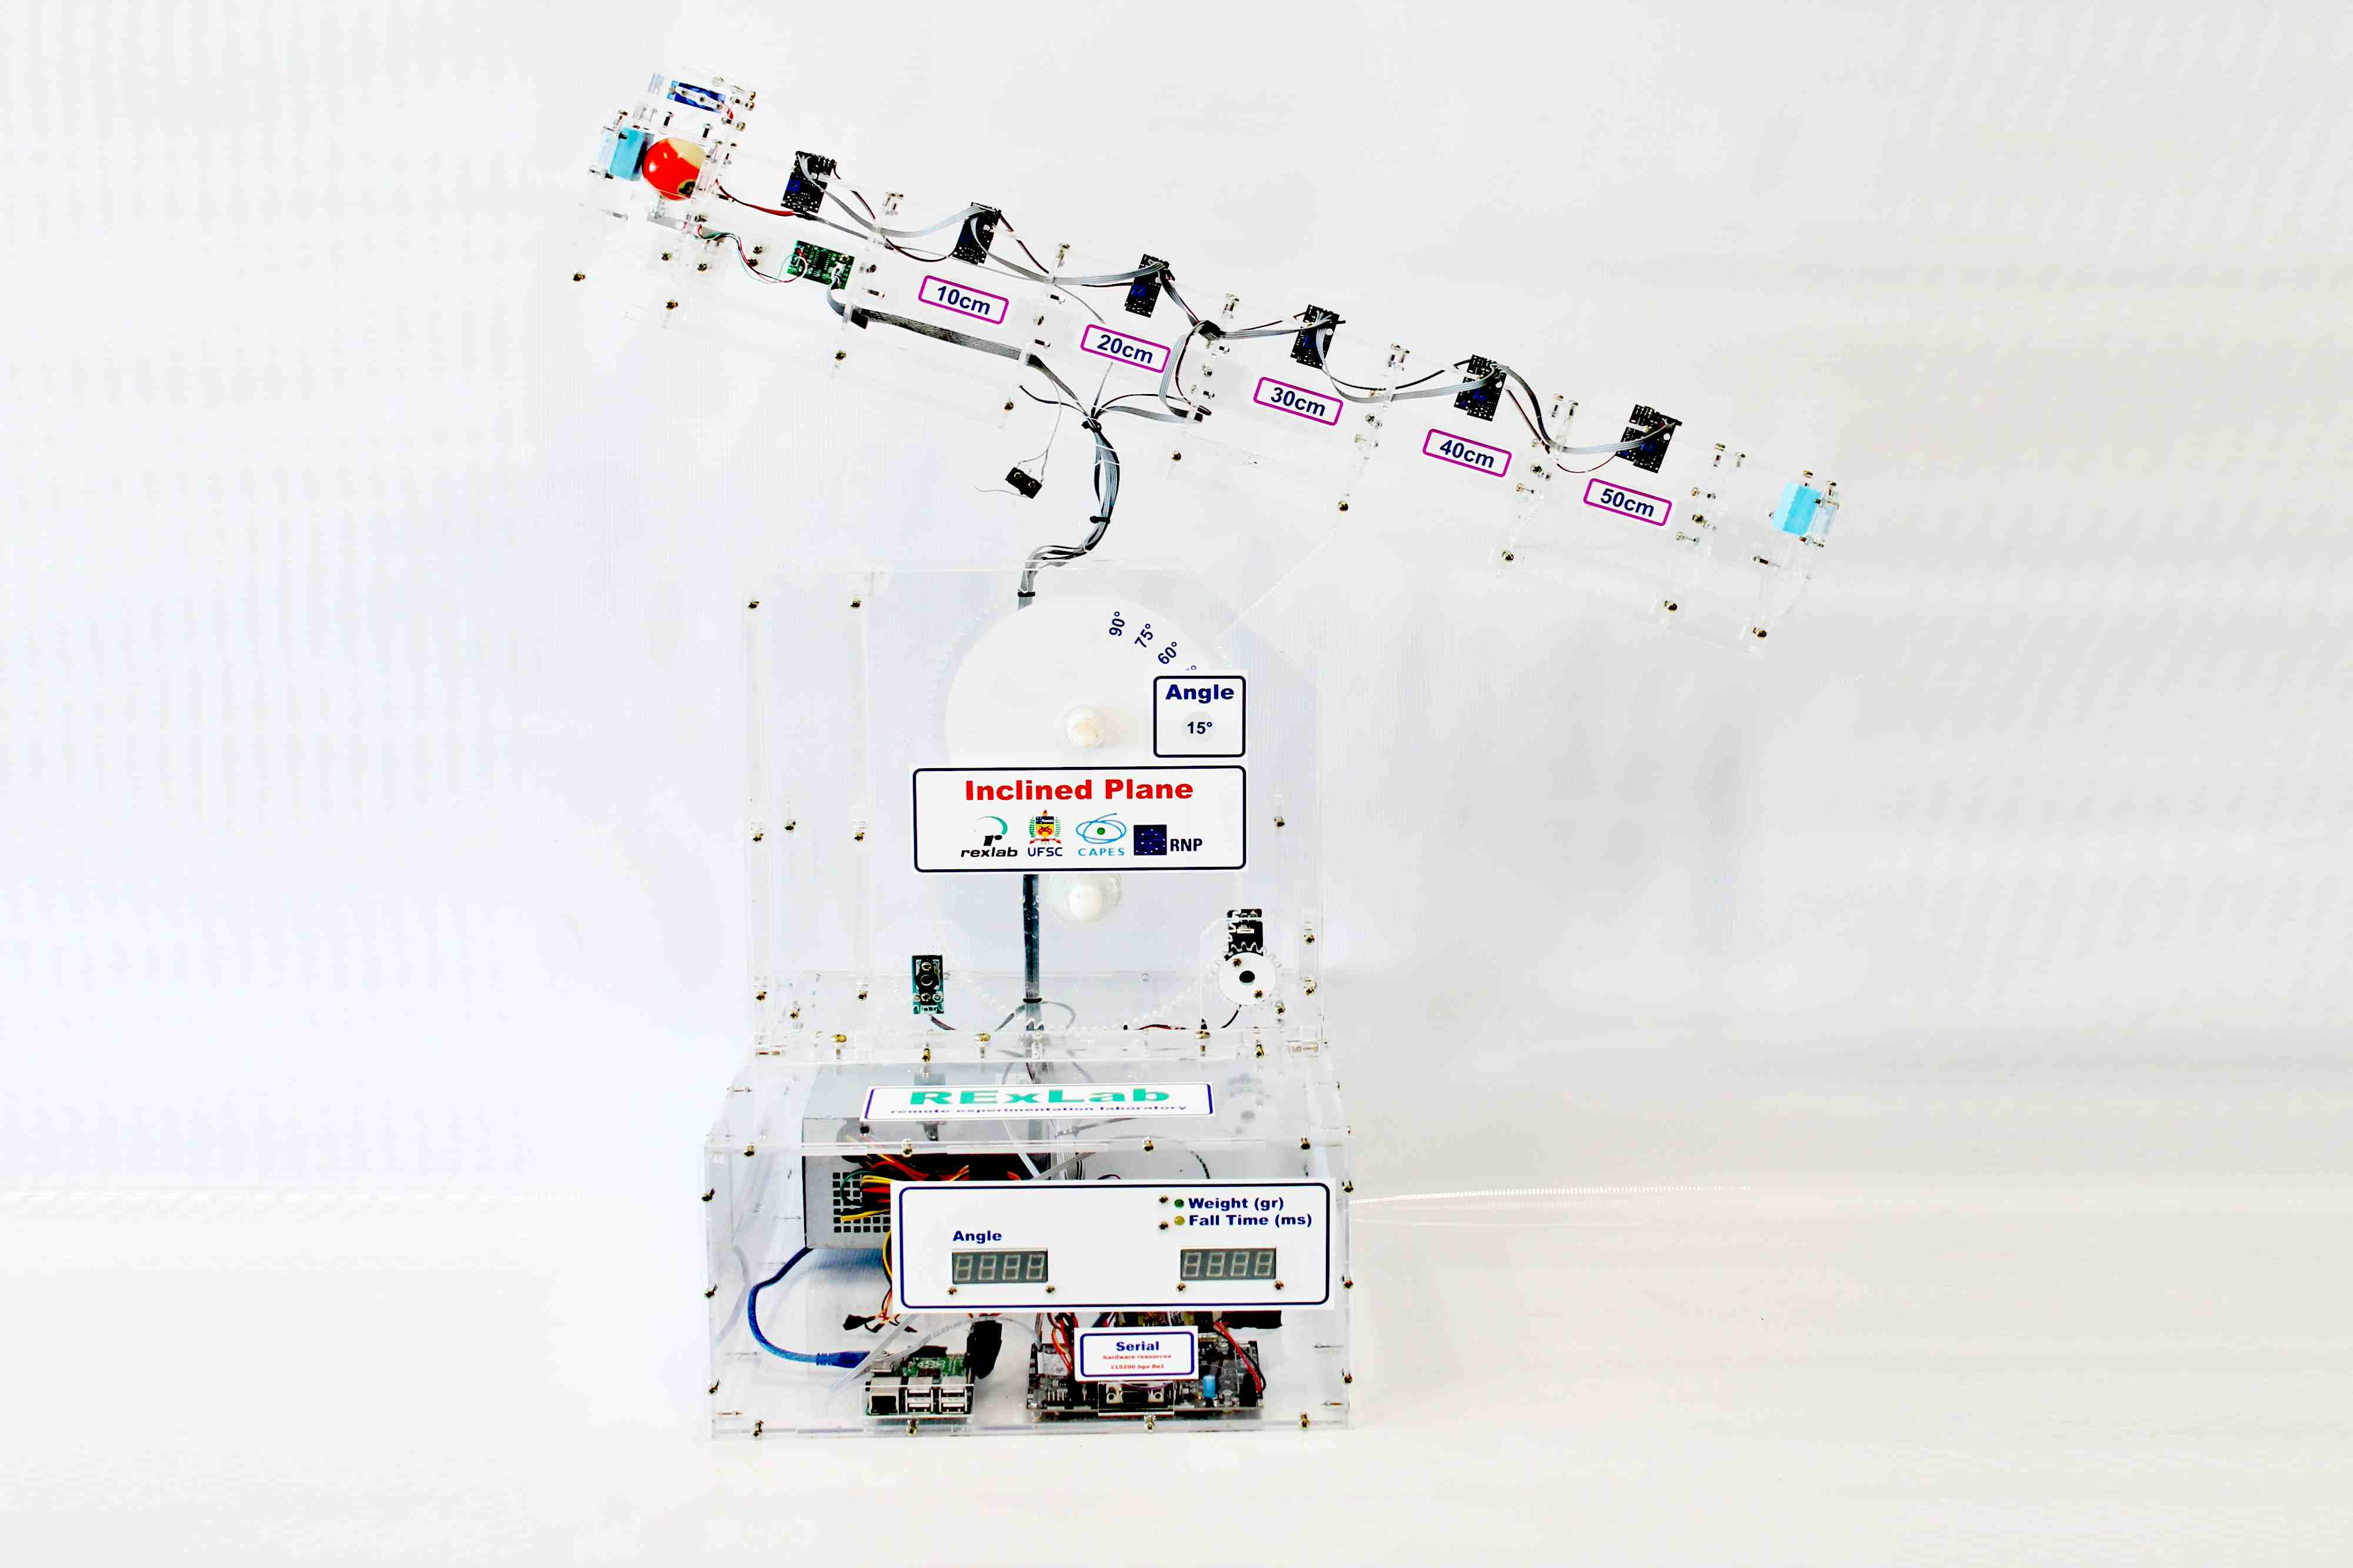
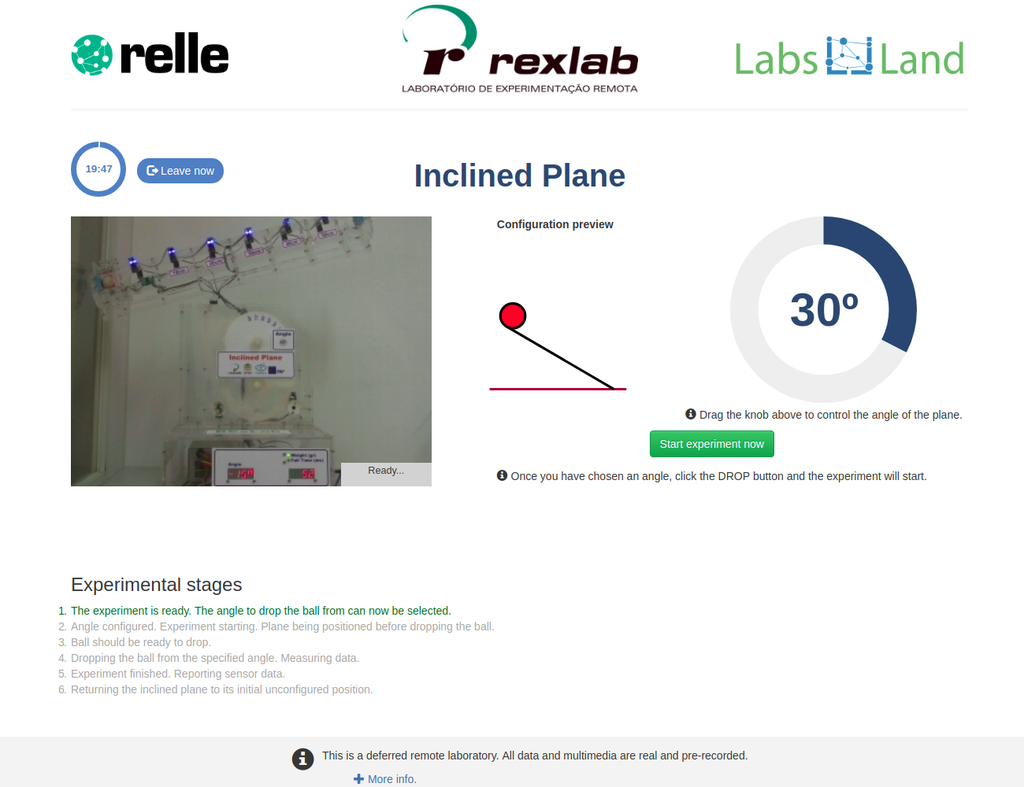
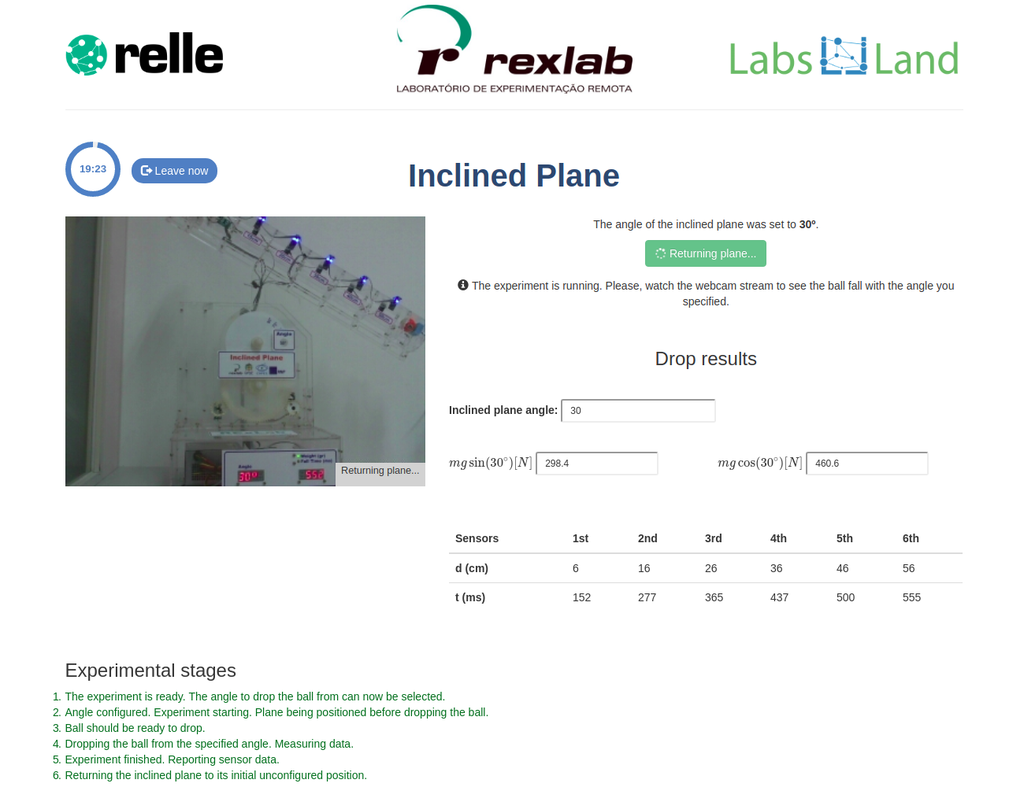
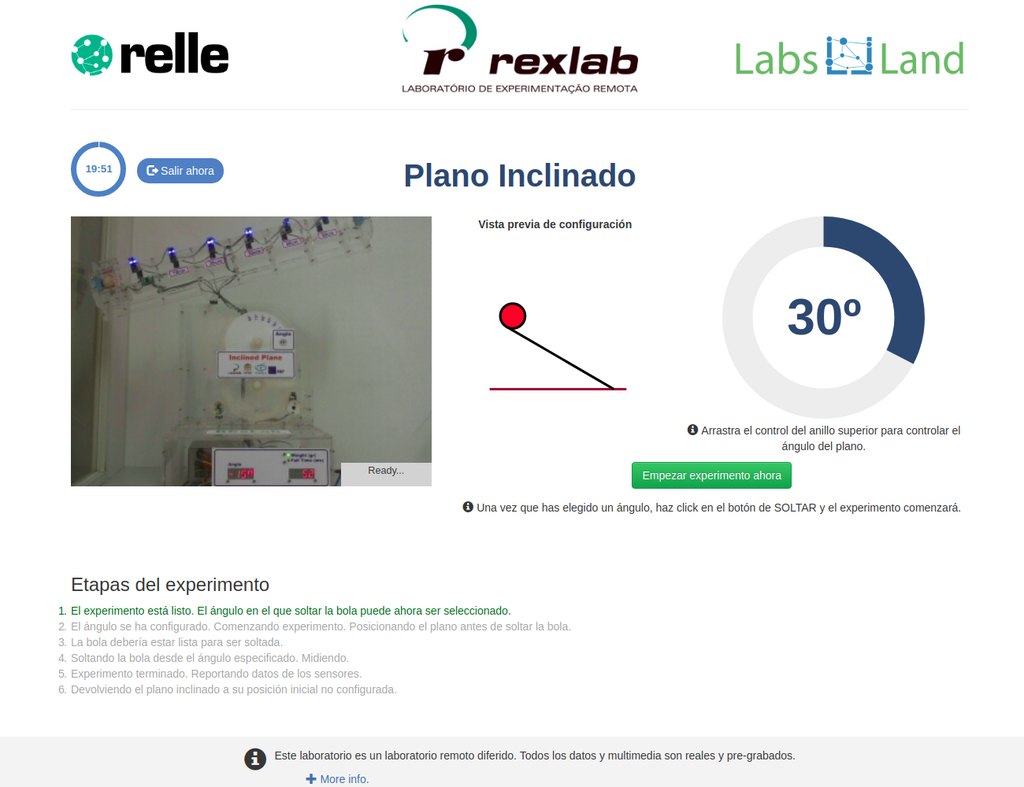
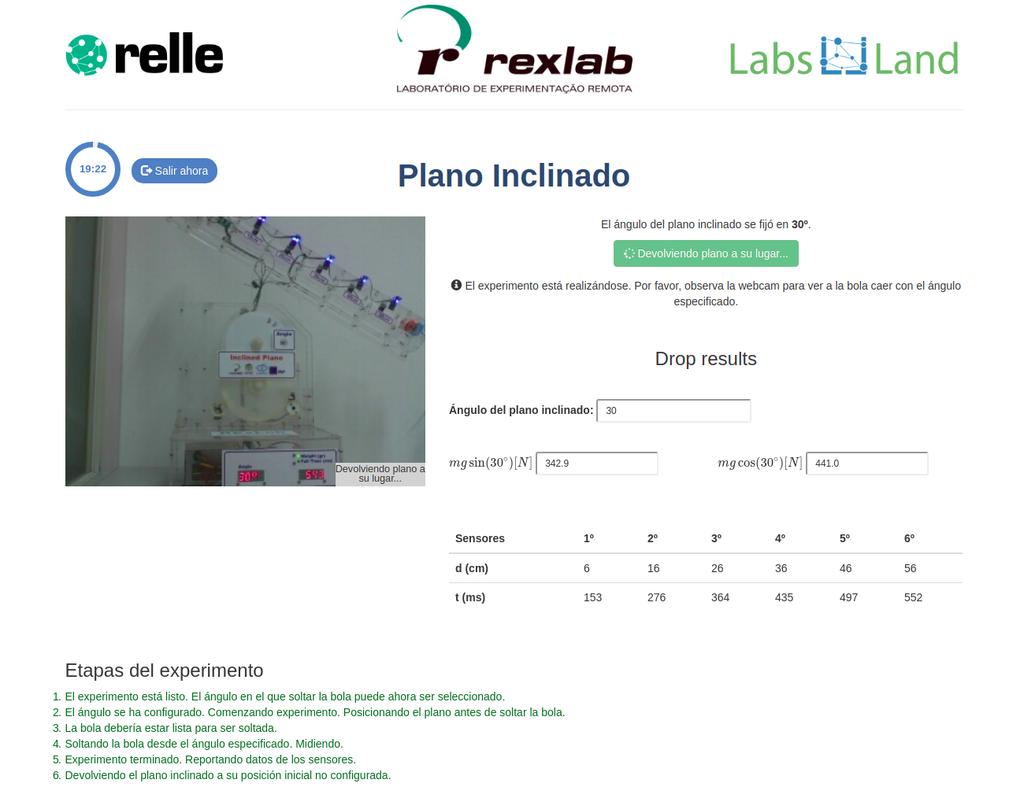
Kinematics
Through this remote laboratory you can experiment with Newton's second law in a system that allows you to observe and analyze the behavior of a ball moving along an inclined plane or in a free fall. The parameters to be analyzed are: time, velocity and acceleration of the ball during the fall. The angle of inclination is configurable by the user, reaching 90º and allowing to experience a scenario of free fall. Check whether the ball rolls while travelling on the inclined plane or it only moves down the plane. Will it depend on the defined inclination? Test it!
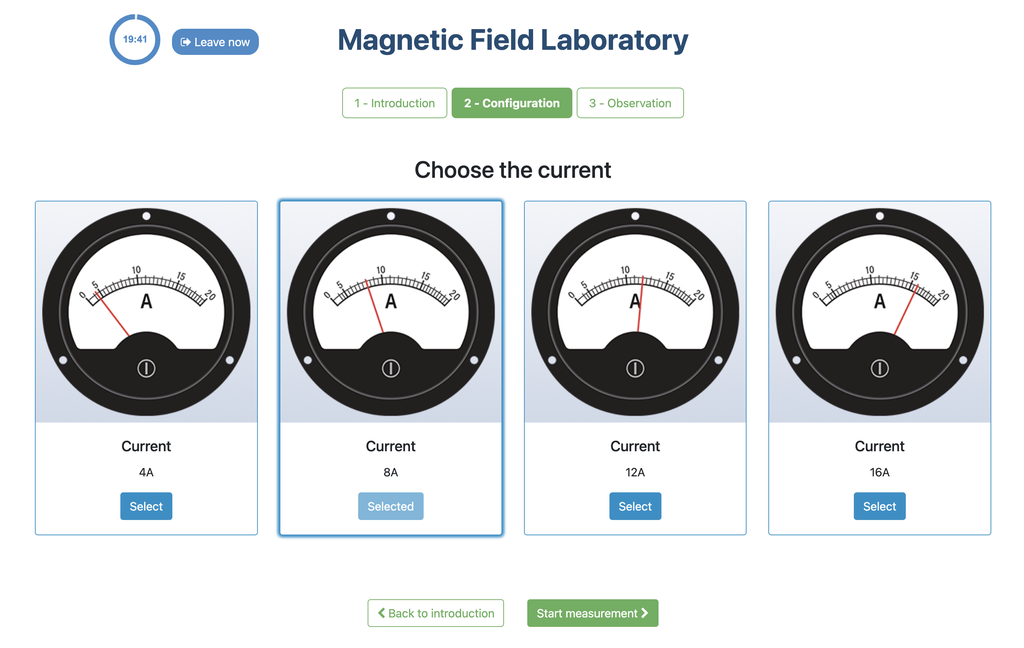
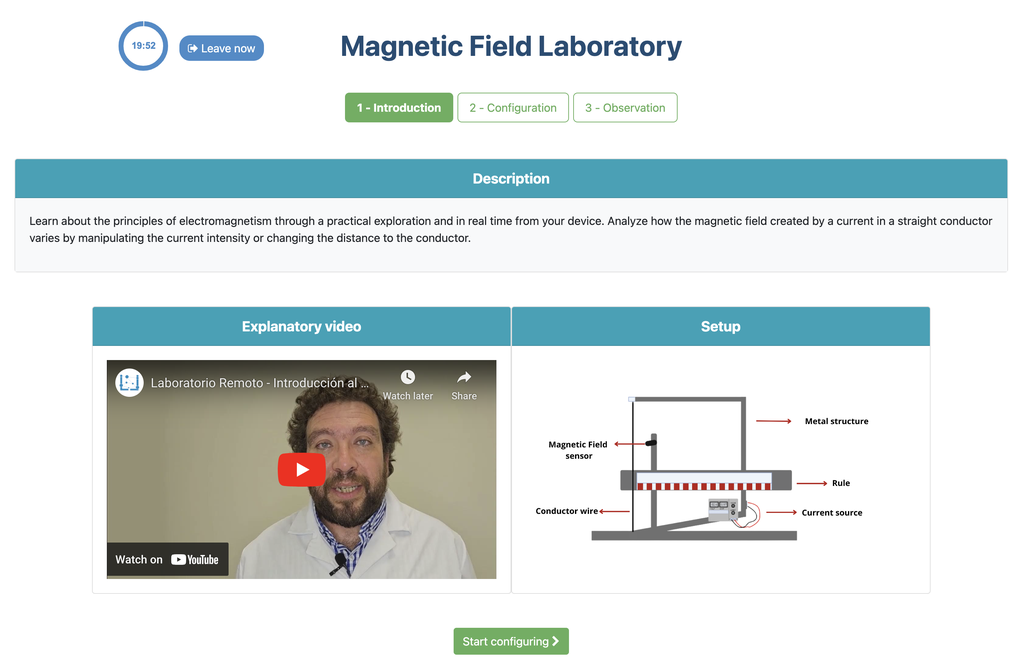
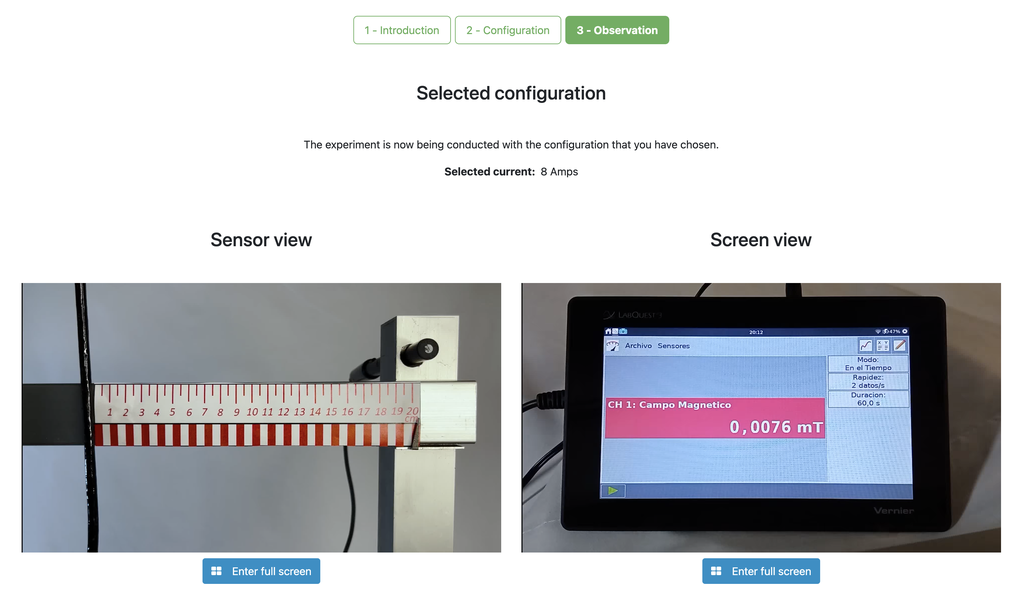
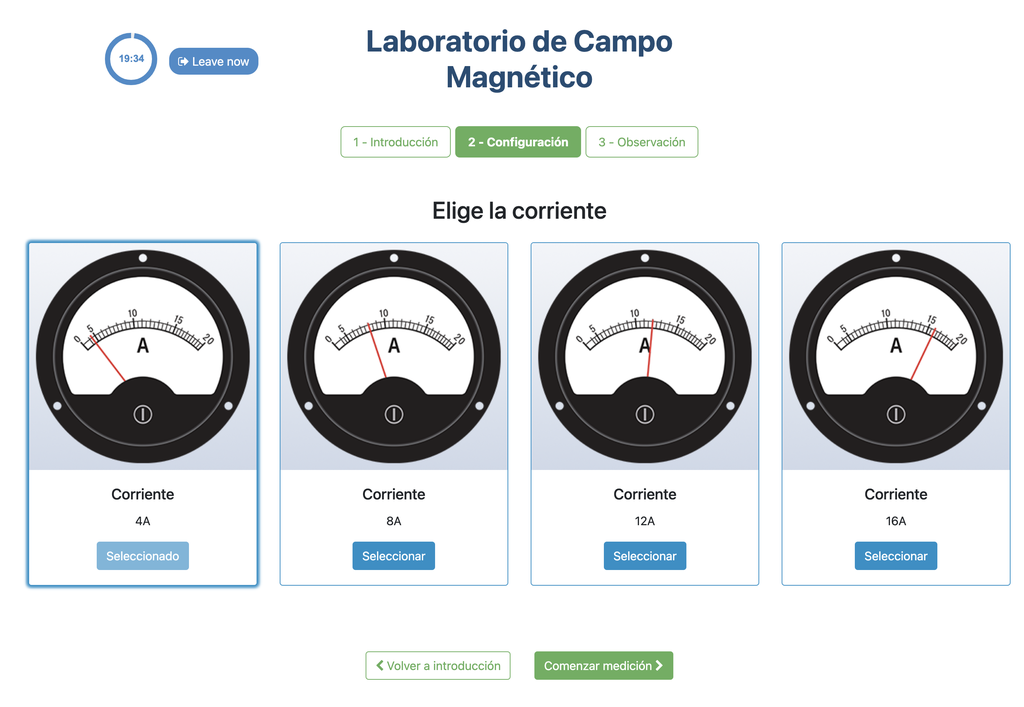
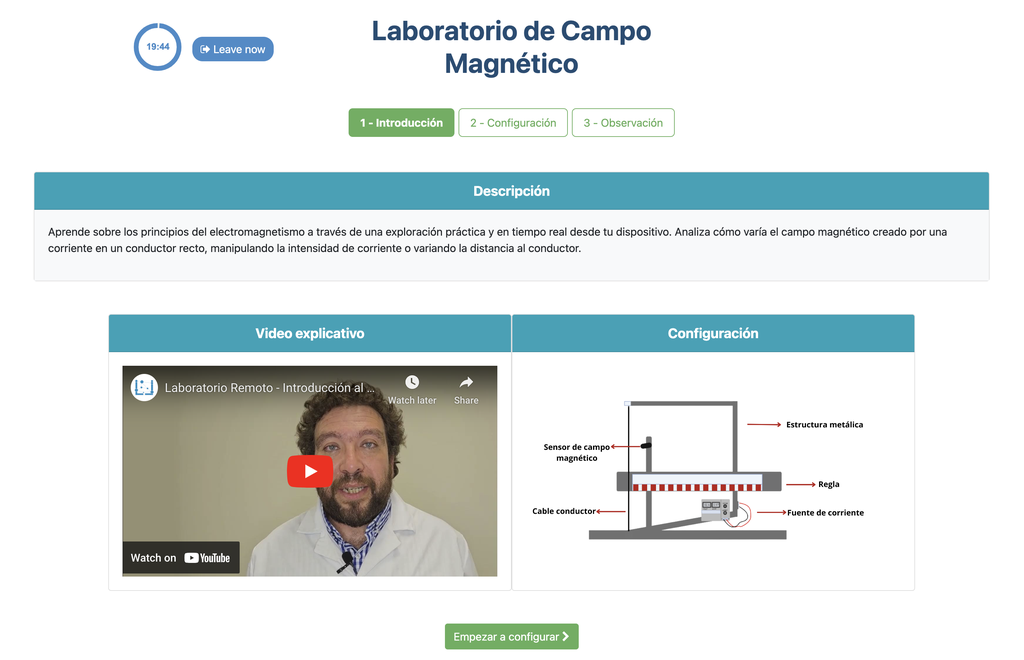
Magnetic Field
Summary
This lab facilitates magnetic field experiments with a steady current in a straight conductor, whose intensity can be adjusted. A movable Hall sensor measures the field's magnitude at various distances. In this version of the lab students manually record the data.
Versions of the lab
In this version of the lab, graphs are not included and data download by the student is not permitted. Instead, the student must collect the data from the sensor readings and the distance to the conductor, similar to a traditional practical experiment. This allows them to construct their own graphs and create custom spreadsheets for data analysis and conclusion drawing.
There is an alternative version of the lab (Magnetic Field with Graph) in which a graph is provided at the end of each experiment and students are allowed to download the data onto a spreadsheet. This version may be especially useful for those students who prefer more direct access to the data collected during the experiment.
Magnetic Field
Moving charged particles have the ability to create a magnetic field around them, which can interact with other moving charged particles. In this context, a conductor through which an electric current flows generates a magnetic field in its surroundings. This physical phenomenon is fundamental in numerous technological advances that we find in our daily lives, such as electric motors and various electronic devices.
Potential Experiments
Numerous experiments can be performed with our lab setup. Users can observe how the strength of the magnetic field varies with the current that generates it. They can explore the fundamental principles of electromagnetic induction, visualizing the link between a changing magnetic field and the induced electric current. By adjusting the probe's distance from the field, they can experimentally verify the inverse square law of magnetism, delving into the intricate relationship between field strength and distance.
Learning Objectives
The lab may cover the following learning objectives:
-
Understand the concept of a magnetic field and how it can be generated and measured.
-
Recognize the relationship between magnetic field strength and the current that generates it.
-
Grasp the principle of electromagnetic induction.
-
Comprehend and verify the inverse square law for magnetic fields.
-
Develop skills in data collection, analysis, and interpretation in a physics context.
-
Enhance their understanding of physical principles and their real-world applications.


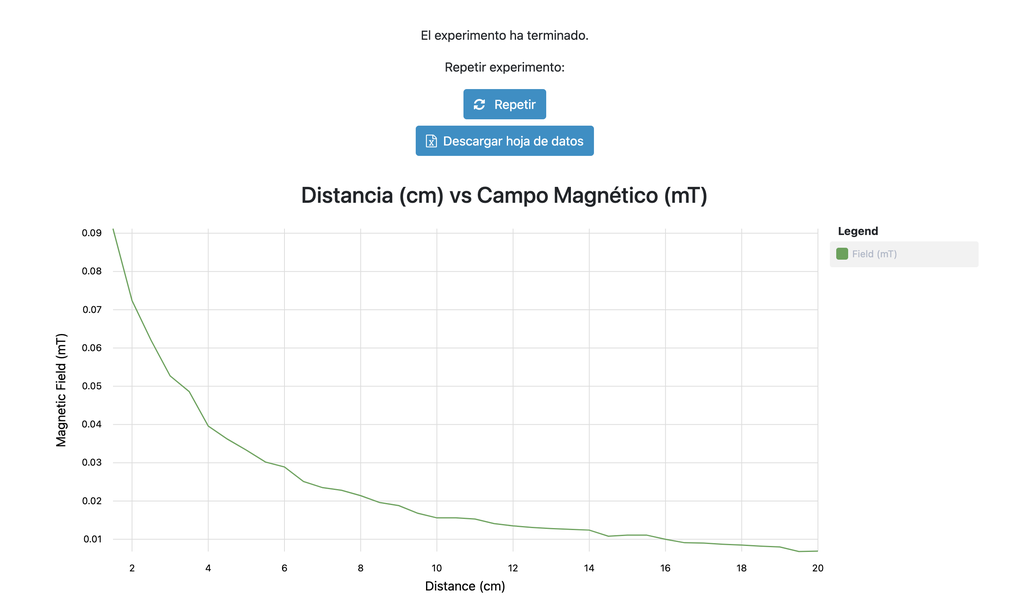
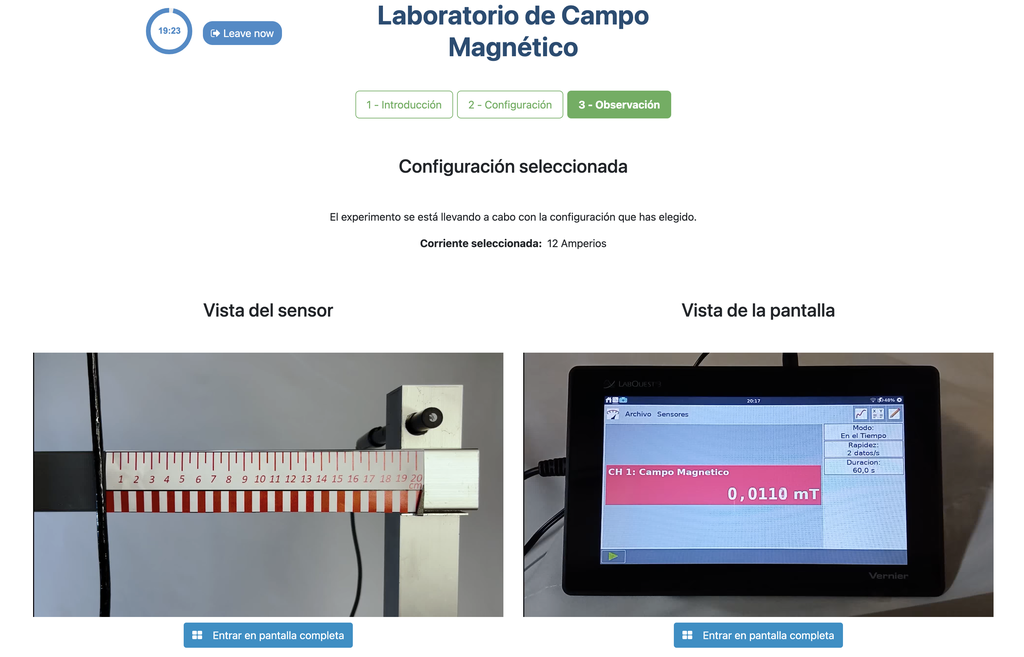
Magnetic Field (with plot)
Summary
This lab facilitates magnetic field experiments with a steady current in a straight conductor, whose intensity can be adjusted. A movable Hall sensor measures the field's magnitude at various distances. In this version of the labs students are shown a plot with the data and may download it for further processing.
Versions of the lab
This version of the laboratory displays a plot at the end of each experiment and allows students to download the data in a spreadsheet. This allows students to analyze the results without needing to gather and plot the data themselves.
An alterantive version of the lab exists (Magnetic Field) in which the plot and the data are not available. That way, in order to analyse the results and reach proper conclusions, students need to gather and plot the data themselves from the discrete sensor readings, similarly to how they would do so in a traditional hands-on lab.
Magnetic Field
Moving charged particles have the ability to create a magnetic field around them, which can interact with other moving charged particles. In this context, a conductor through which an electric current flows generates a magnetic field in its surroundings. This physical phenomenon is fundamental in numerous technological advances that we find in our daily lives, such as electric motors and various electronic devices.
Potential Experiments
Numerous experiments can be performed with our lab setup. Users can observe how the strength of the magnetic field varies with the current that generates it. They can explore the fundamental principles of electromagnetic induction, visualizing the link between a changing magnetic field and the induced electric current. By adjusting the probe's distance from the field, they can experimentally verify the inverse square law of magnetism, delving into the intricate relationship between field strength and distance.
Learning Objectives
The lab may cover the following learning objectives:
-
Understand some processes of scientific endeavor through the development of a controlled experiment and the collection and interpretation of data associated with a physical phenomenon.
-
Recognize electric current as a source of magnetic field.
-
Find the relationship between the value of the magnetic field in a given direction and the current intensity through a straight conductor.
-
Find the relationship between the value of the magnetic field in a given direction and the distance to the conductor.


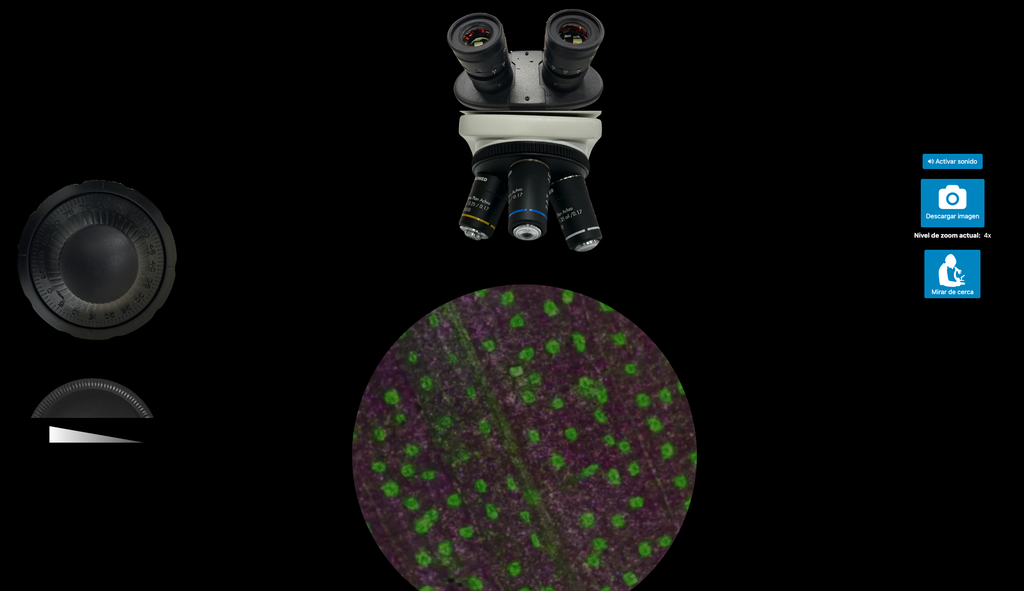
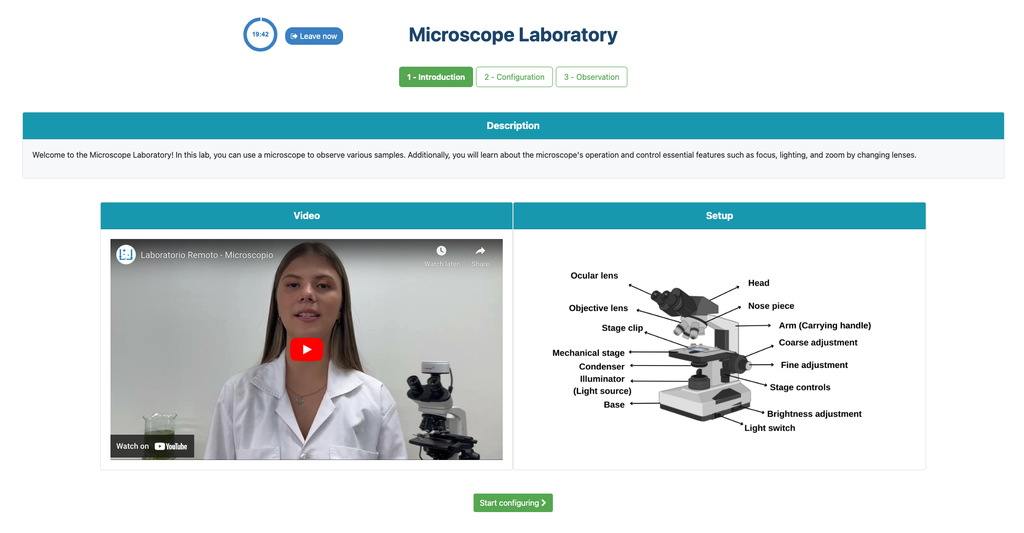
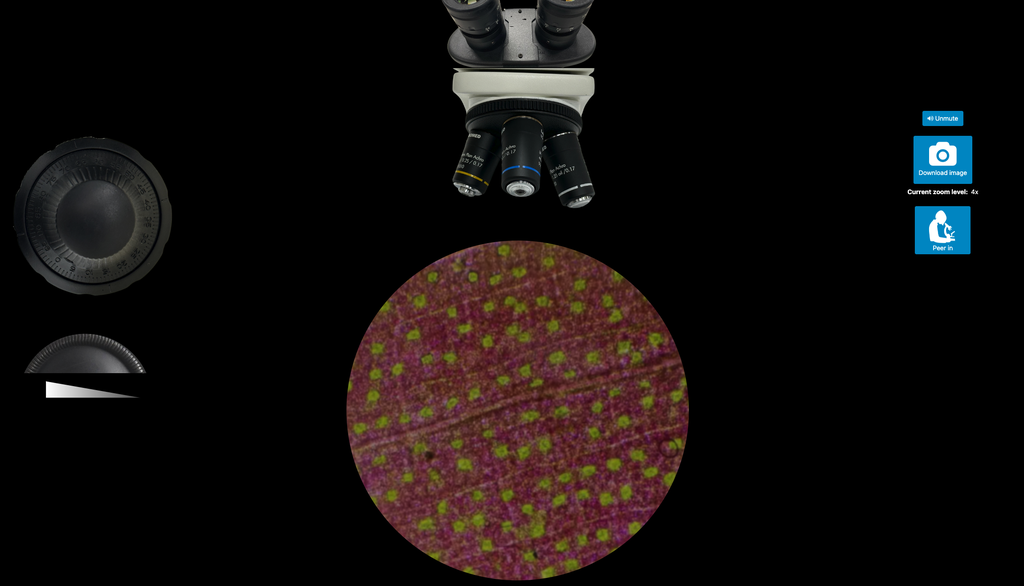
Microscope (Direct)
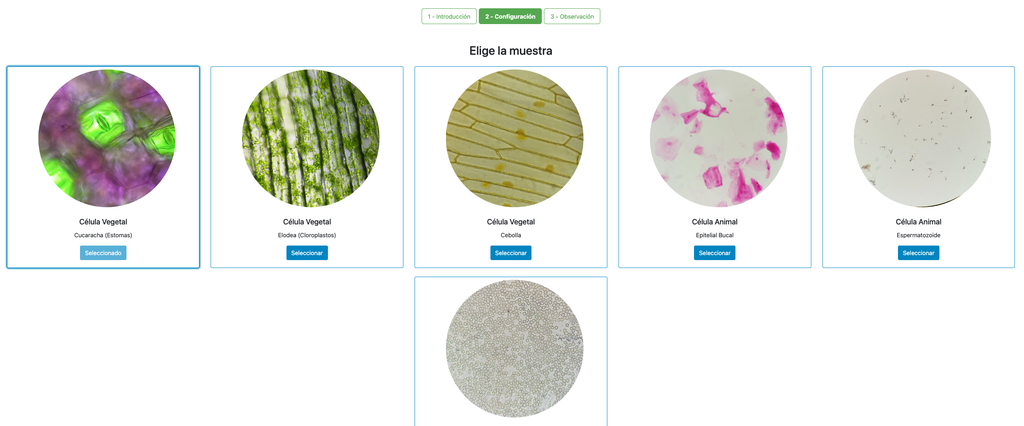
In the Microscope Laboratory, you can explore a variety of samples using basic microscopy techniques. Learn how to operate the microscope, including adjusting focus, managing lighting, and changing lenses to control zoom levels. Observe different plant and animal tissue samples, gain hands-on experience with essential microscopy features, and deepen your understanding of how microscopes work. This version of the lab includes a preparation phase but it is optional and can be skipped.


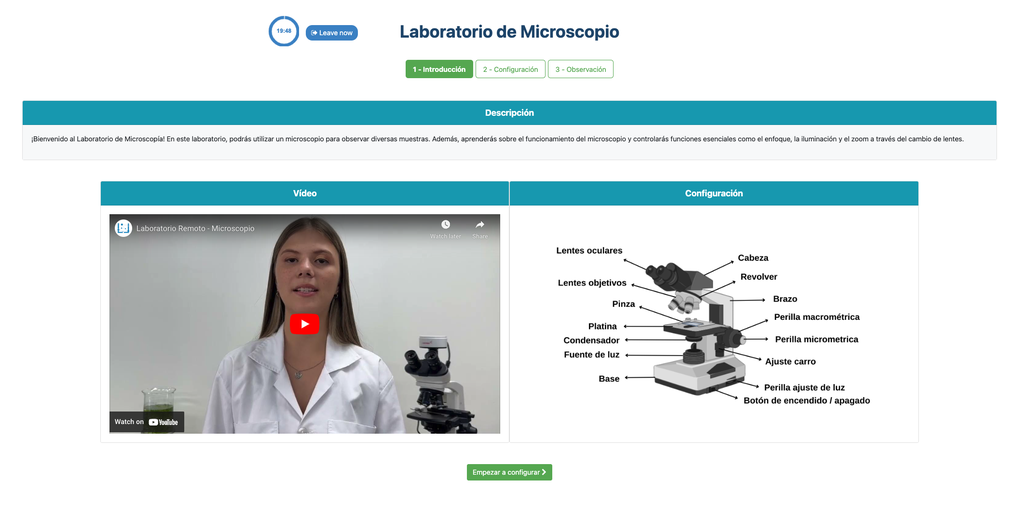
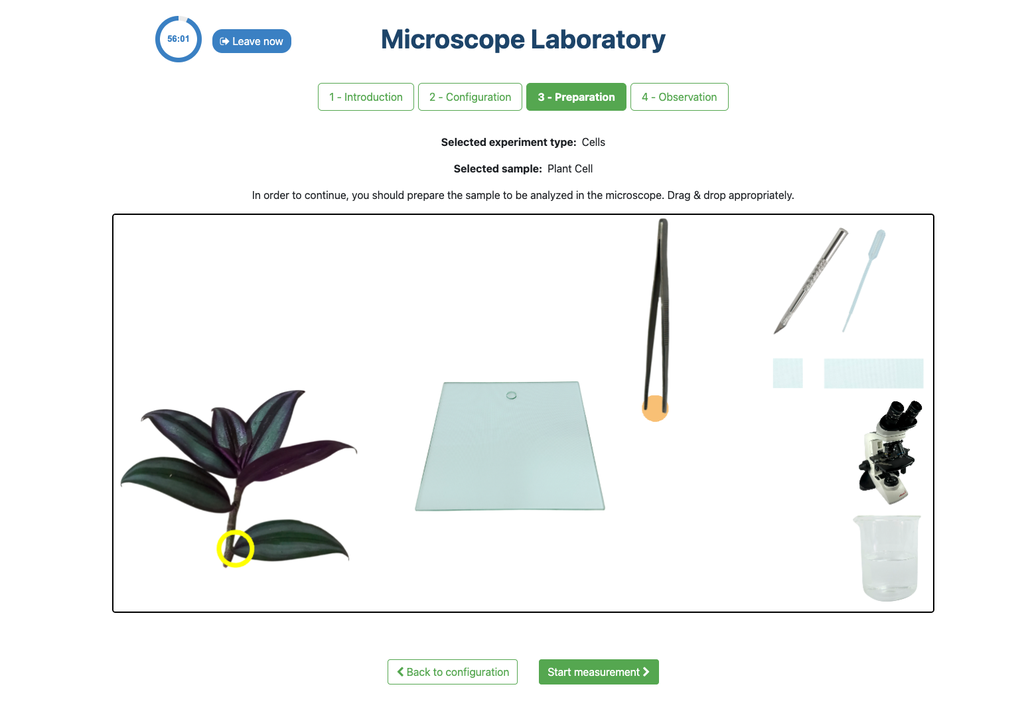

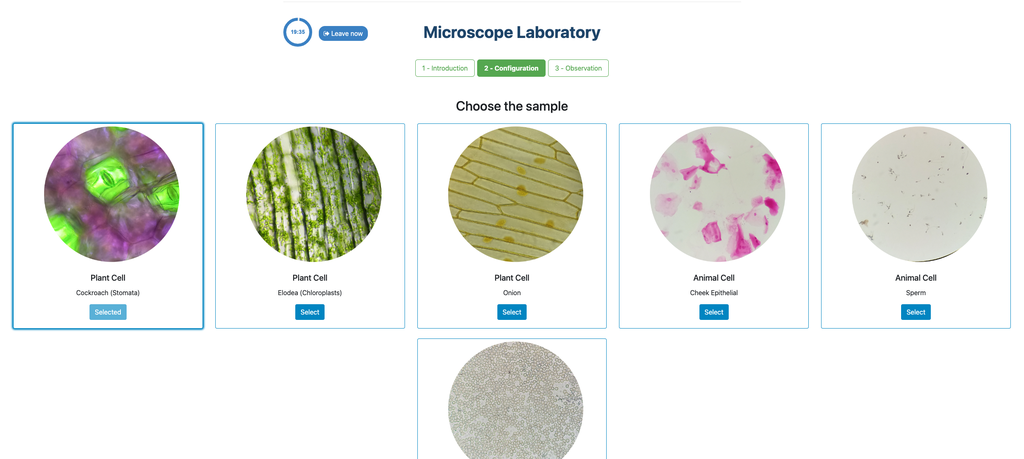
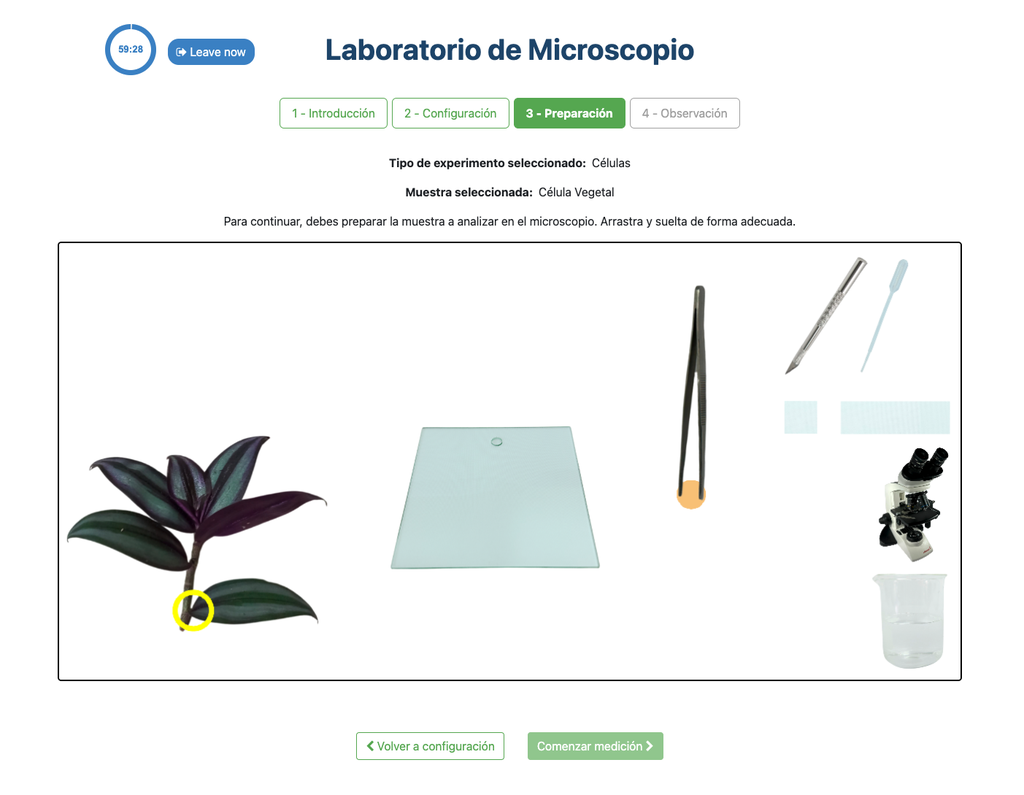
Microscope (Prep)
In the Microscope Laboratory, you can explore a variety of samples using basic microscopy techniques. Learn how to operate the microscope, including adjusting focus, managing lighting, and changing lenses to control zoom levels. Observe different plant and animal tissue samples, gain hands-on experience with essential microscopy features, and deepen your understanding of how microscopes work. In this version of the Microscope lab, successfully preparing the sample is mandatory before controlling the microscope itself.


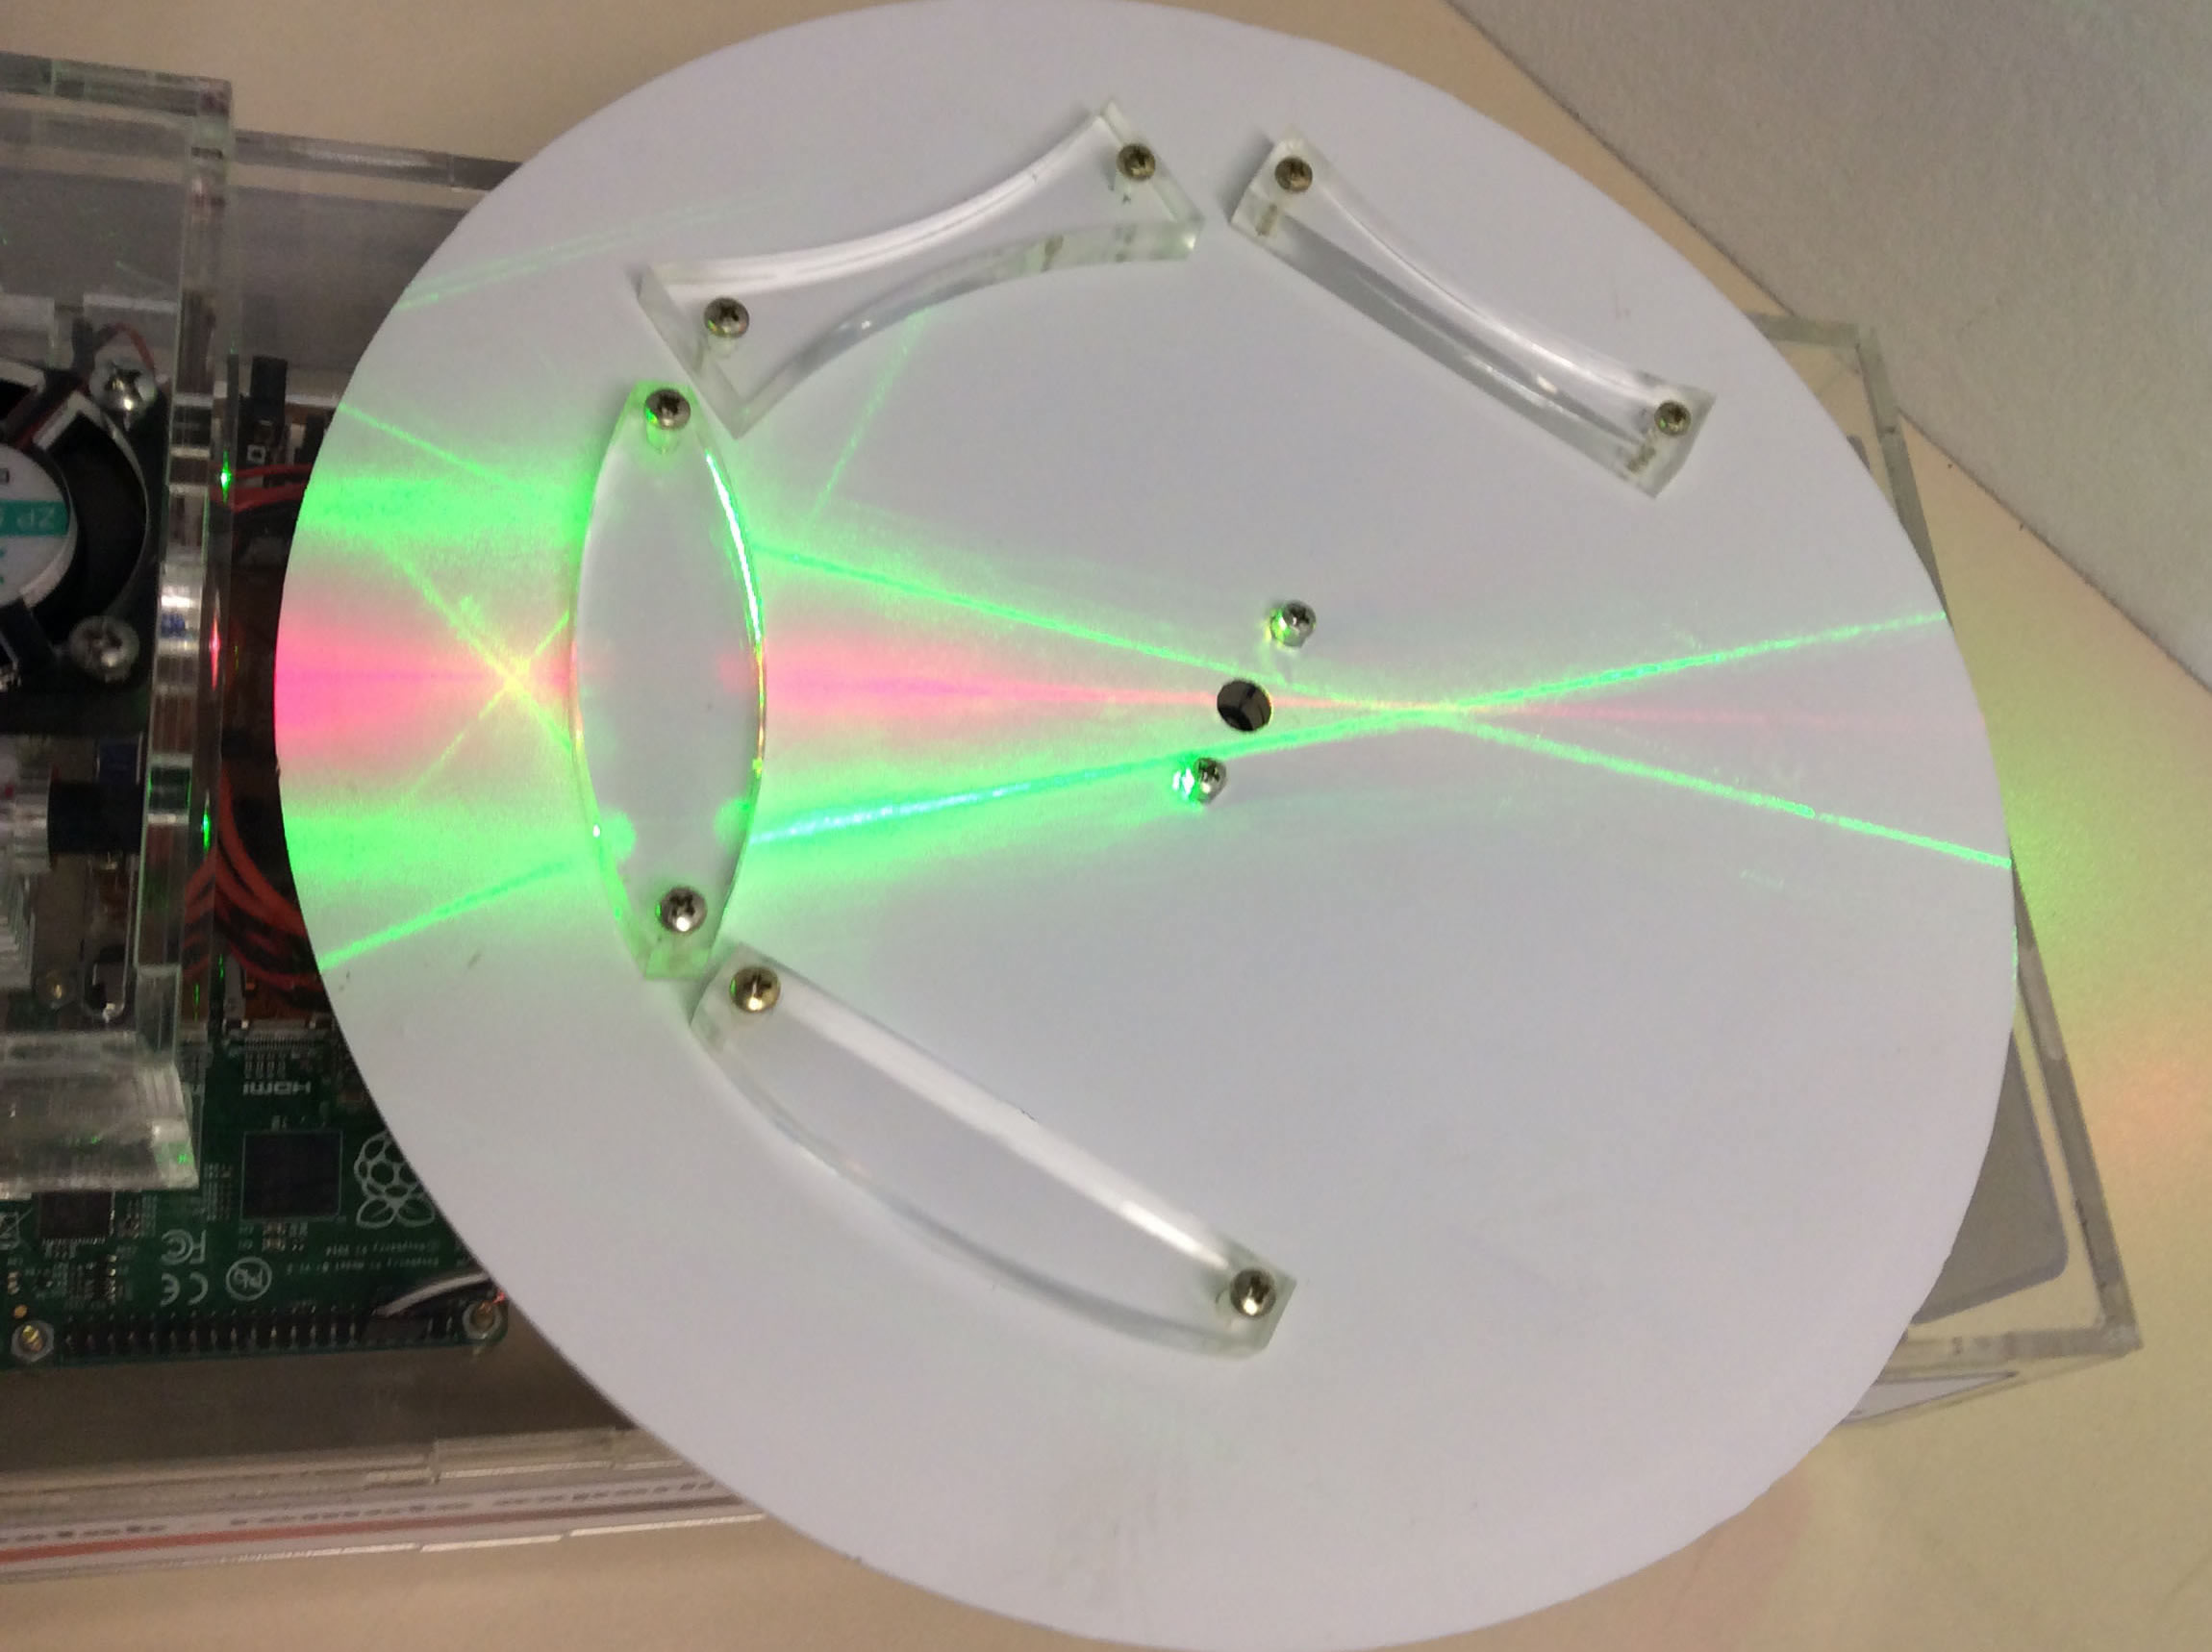
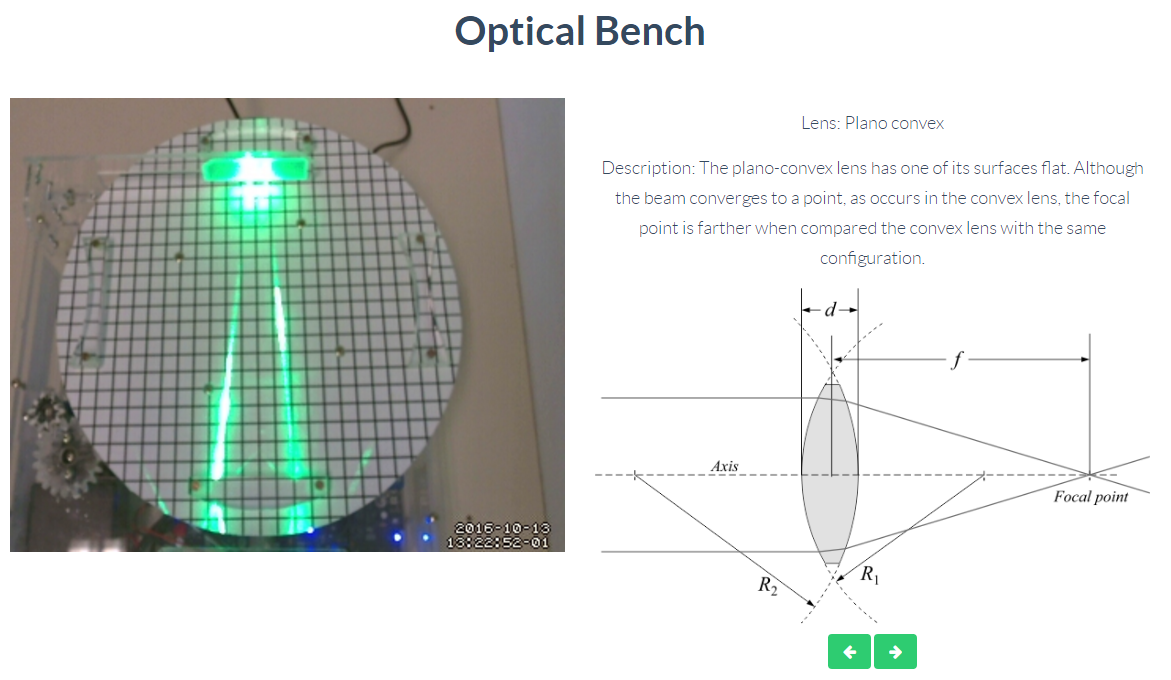
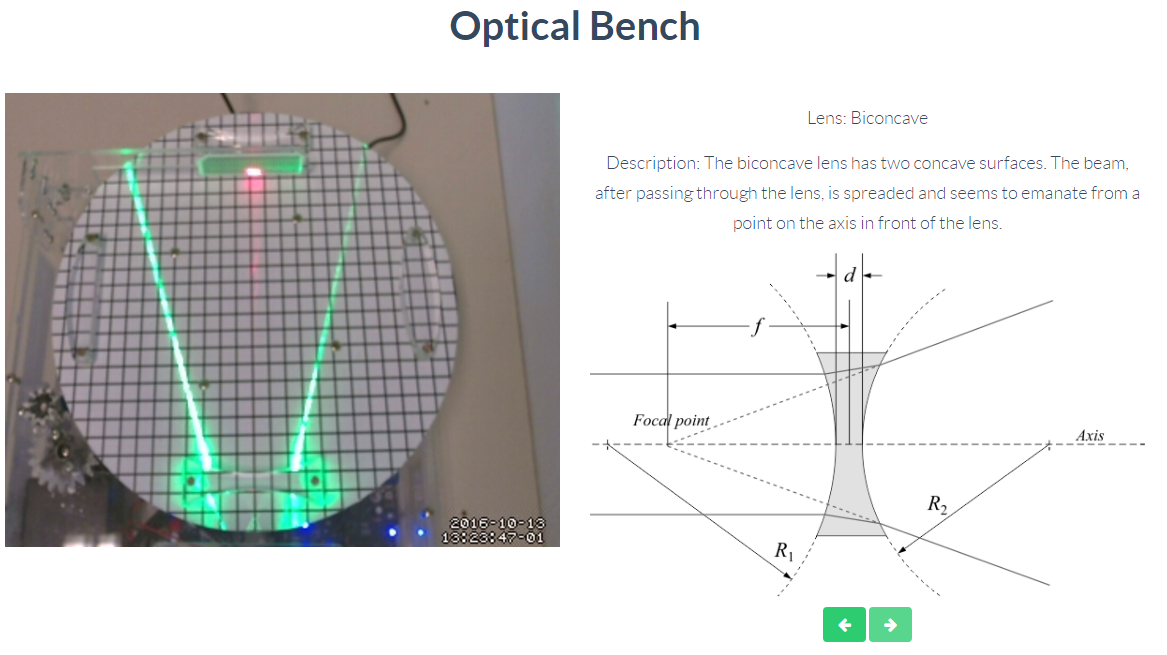
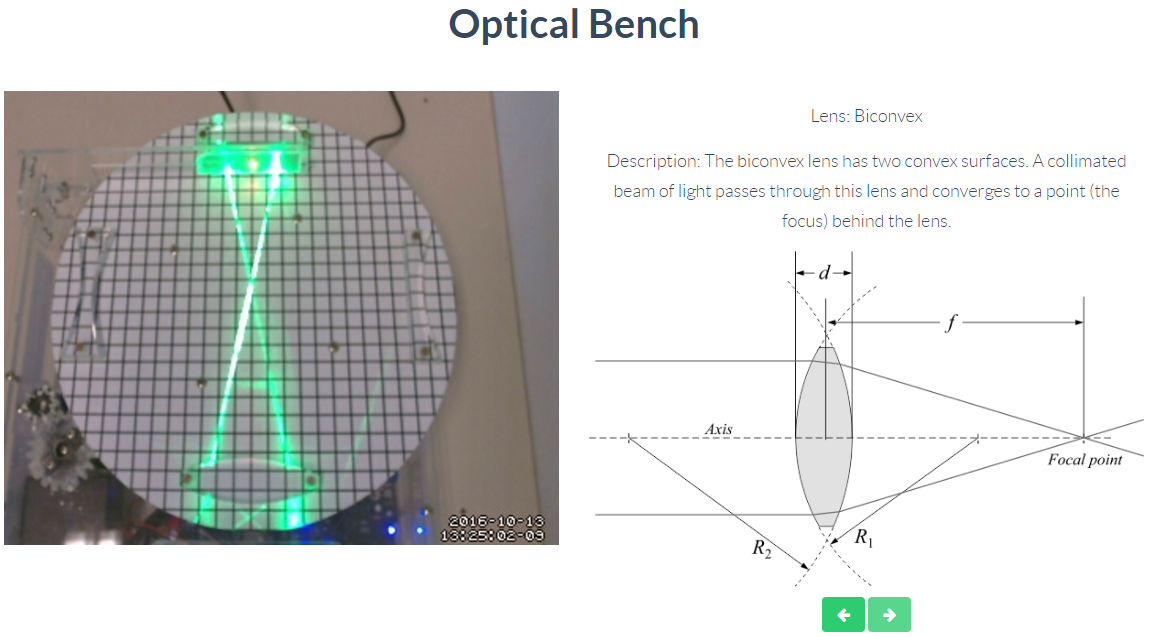
Optics
Through this remote lab you can experiment what happens with two rays of light passing through a biconvex, biconcave or convex lens. You can control the lens at any time.
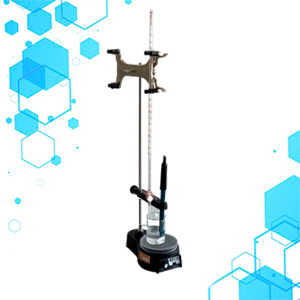
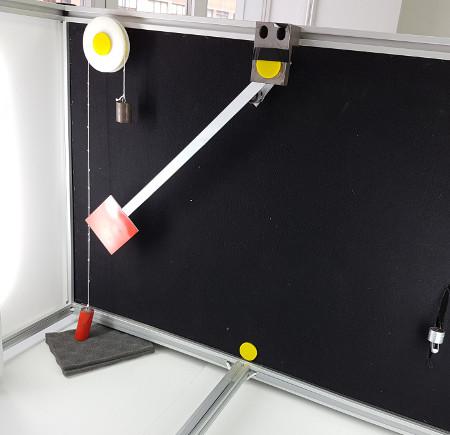
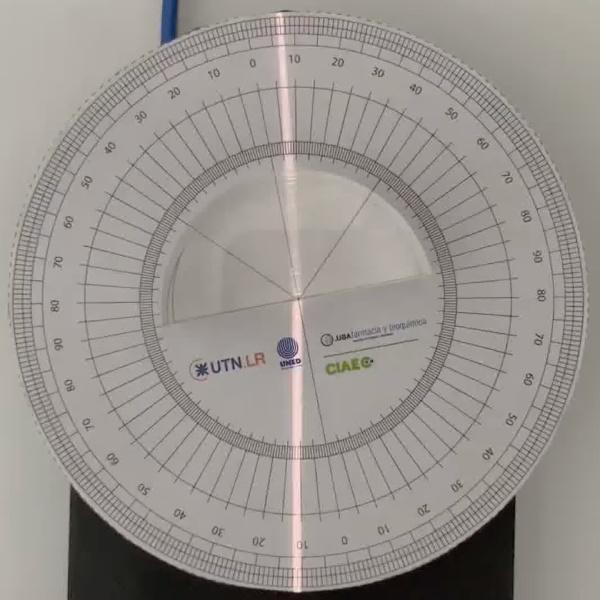
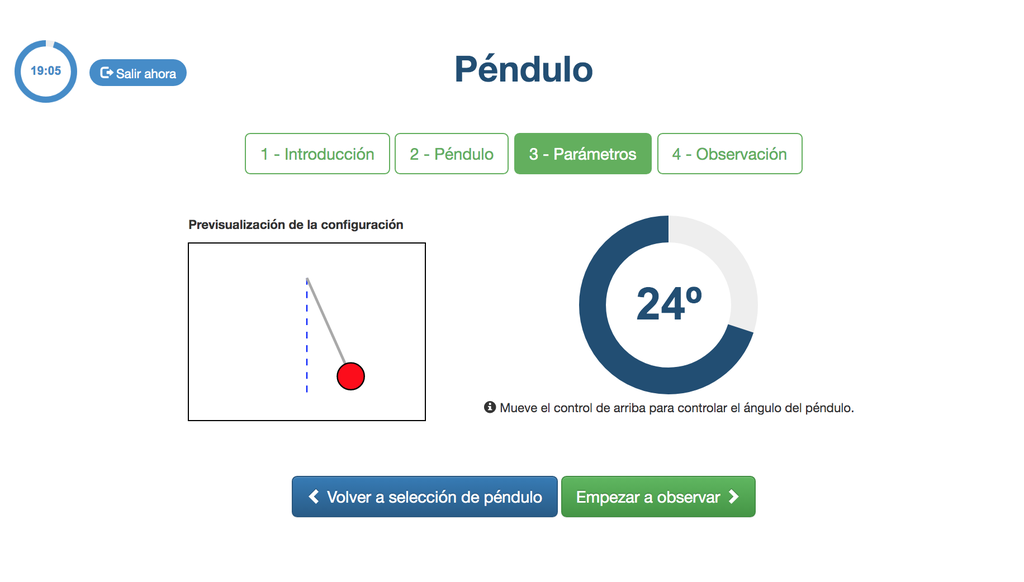
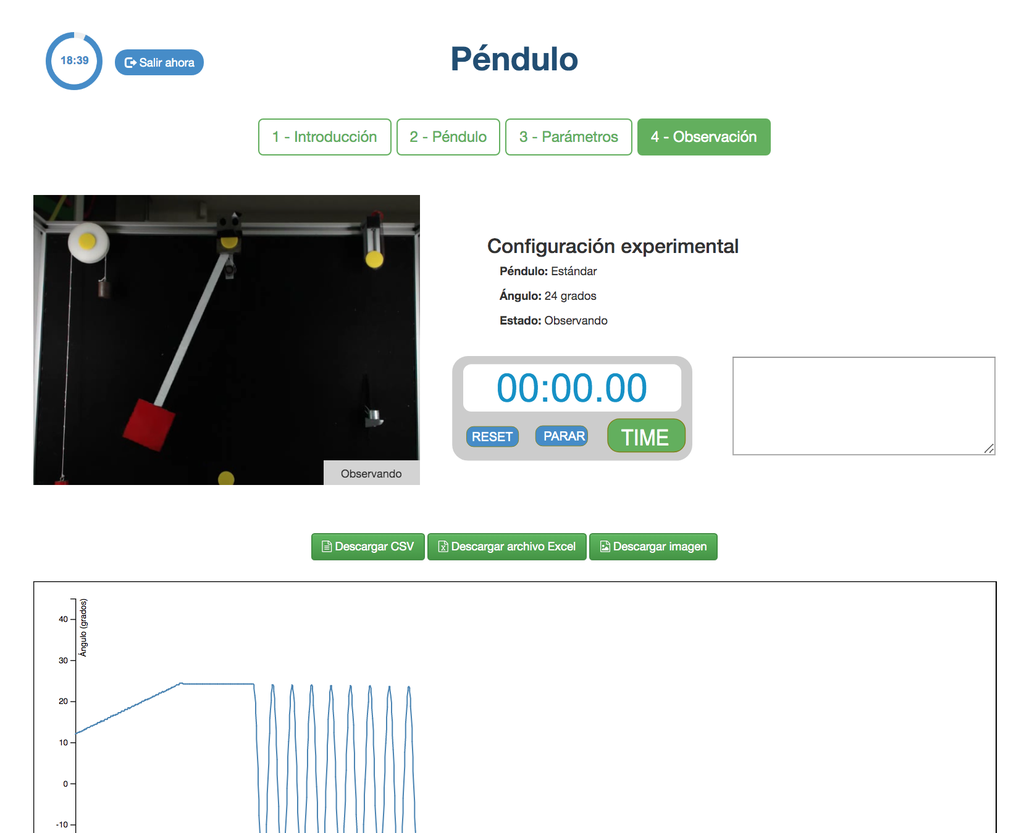
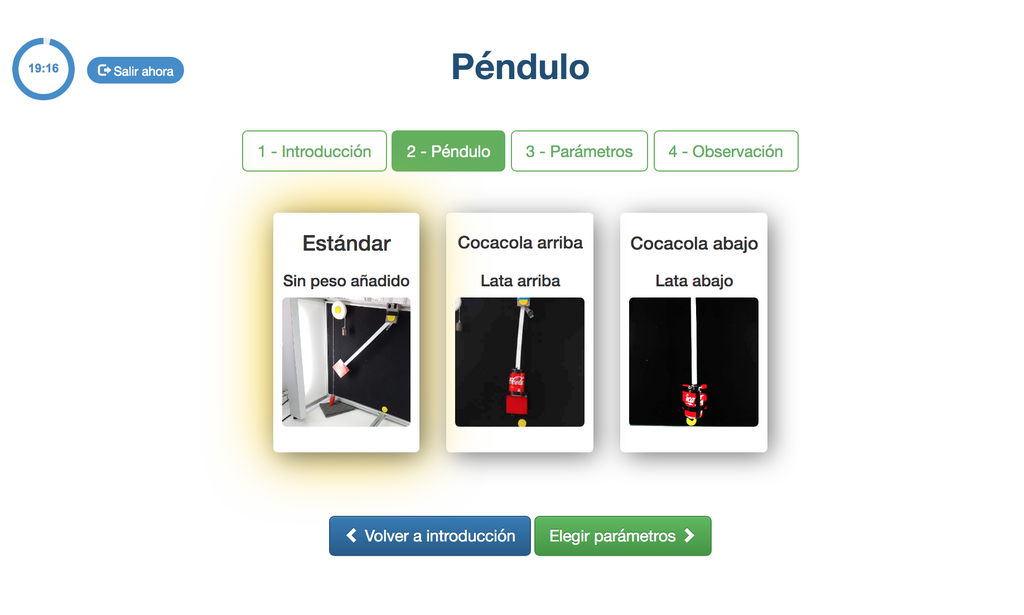
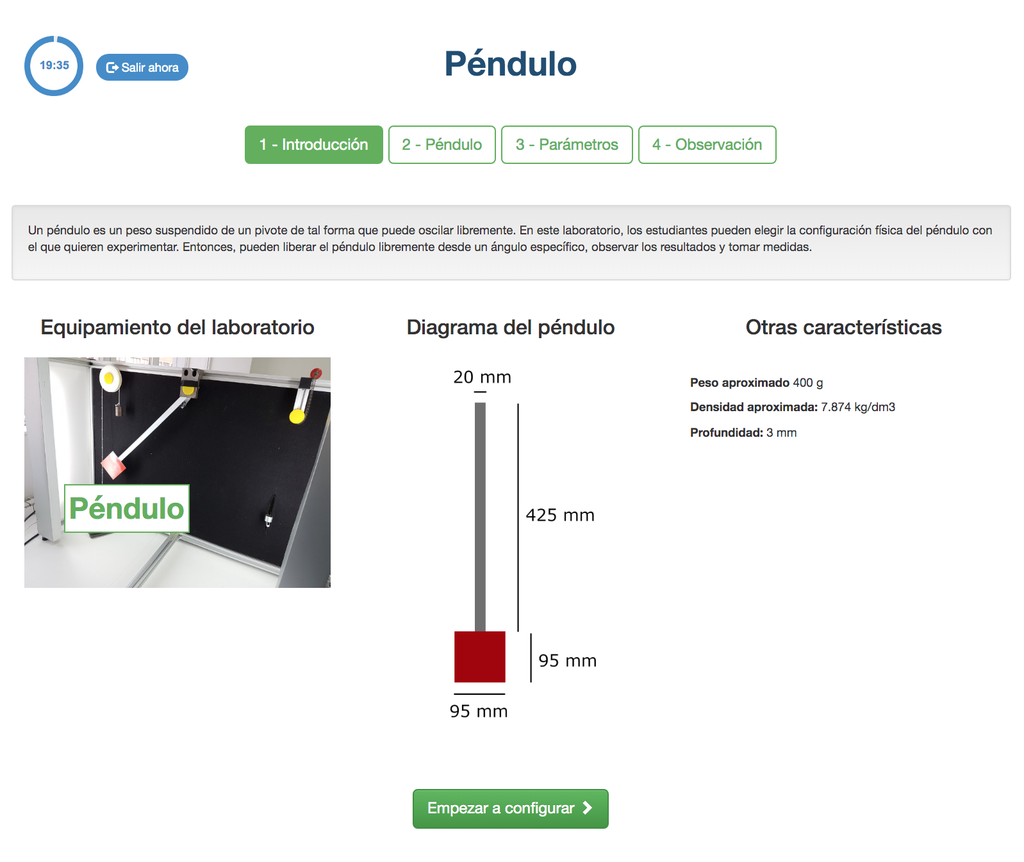
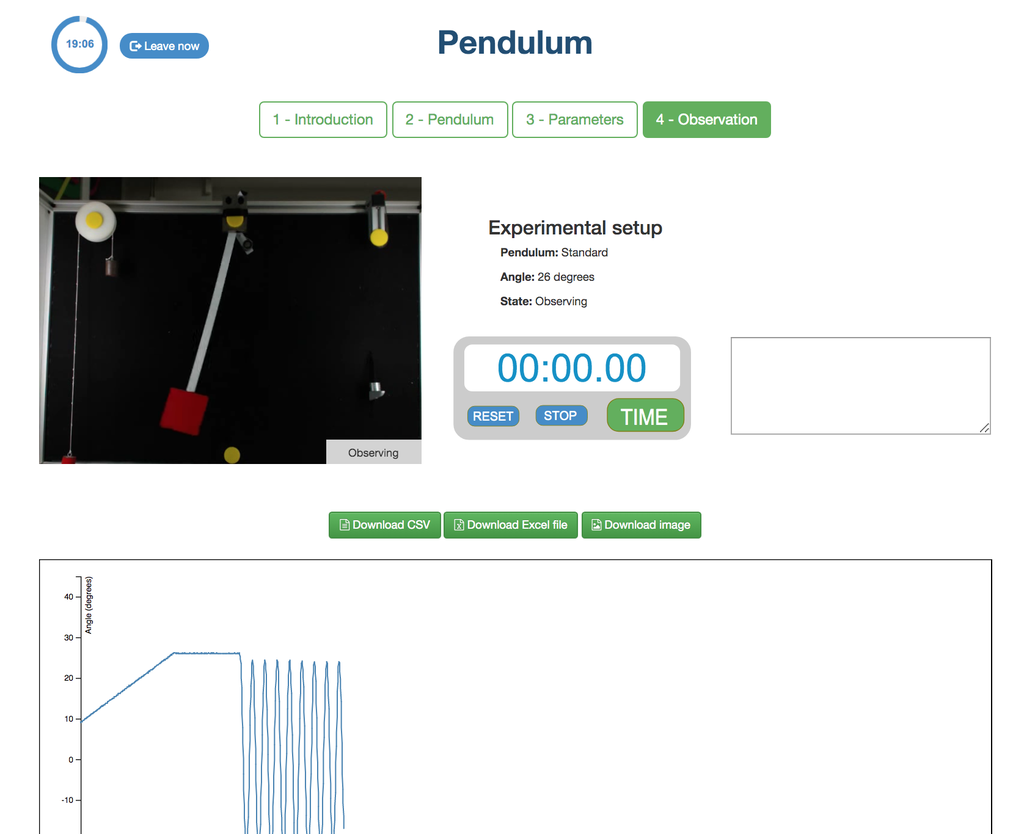
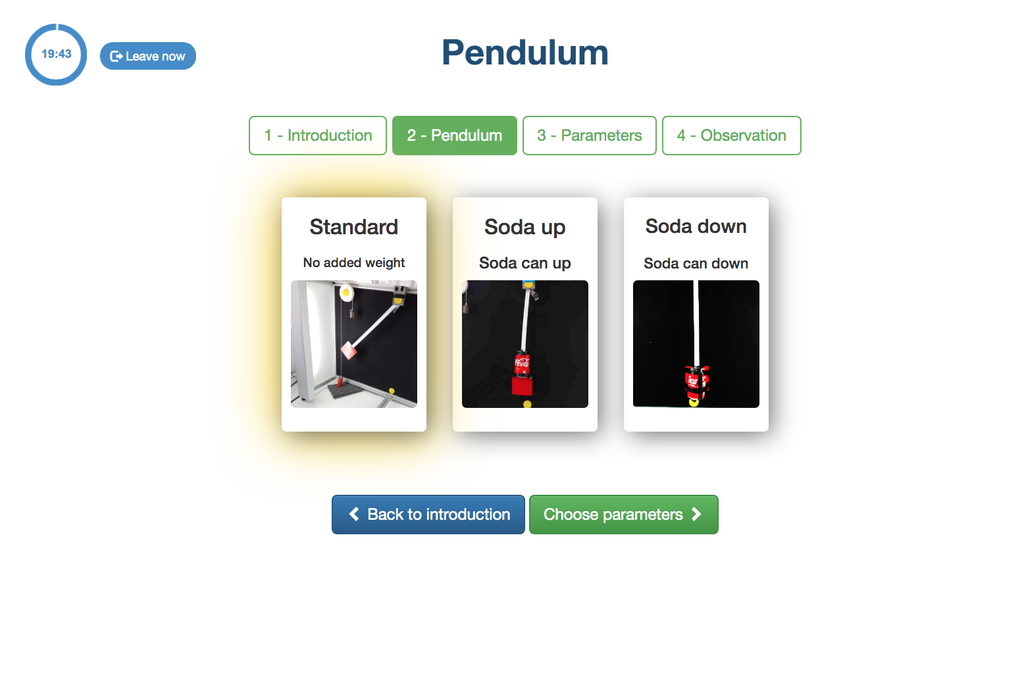
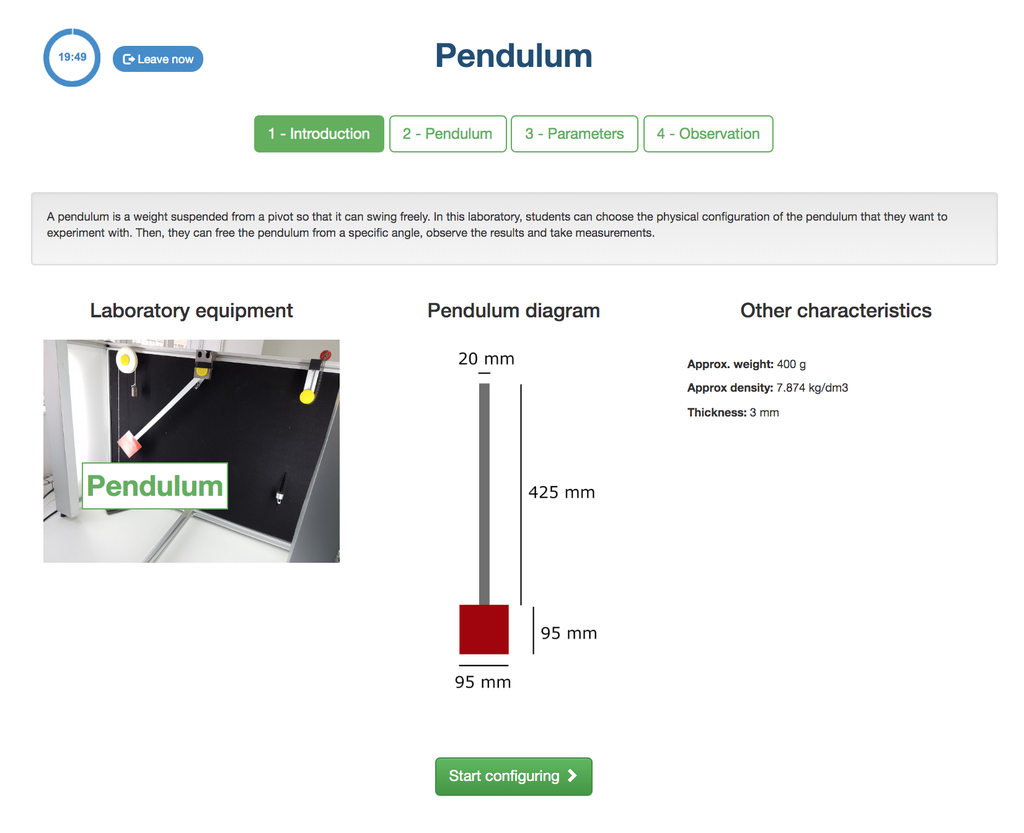
Pendulum
With this experiment, you can control the initial angle of the load, and see the behavior in a real simple pendulum. This experiment will provide you a set of real data that you can use to analyze the behavior of the pendulum depending on the particular millisecond, speed, oscillation length, etc. You can also attach weights to the pendulum.

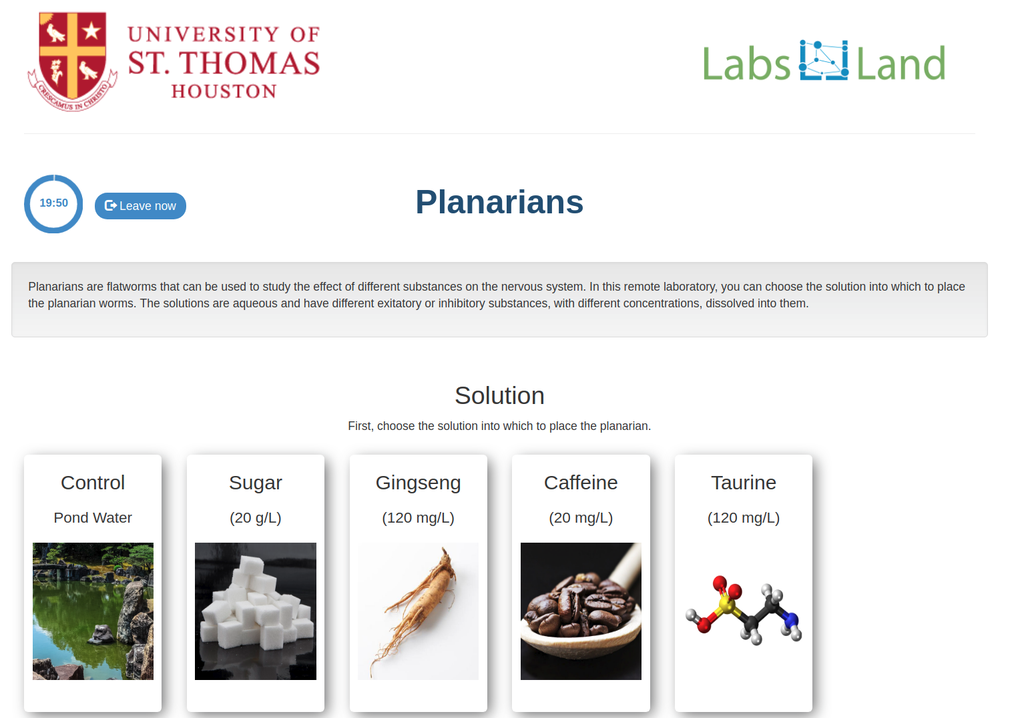
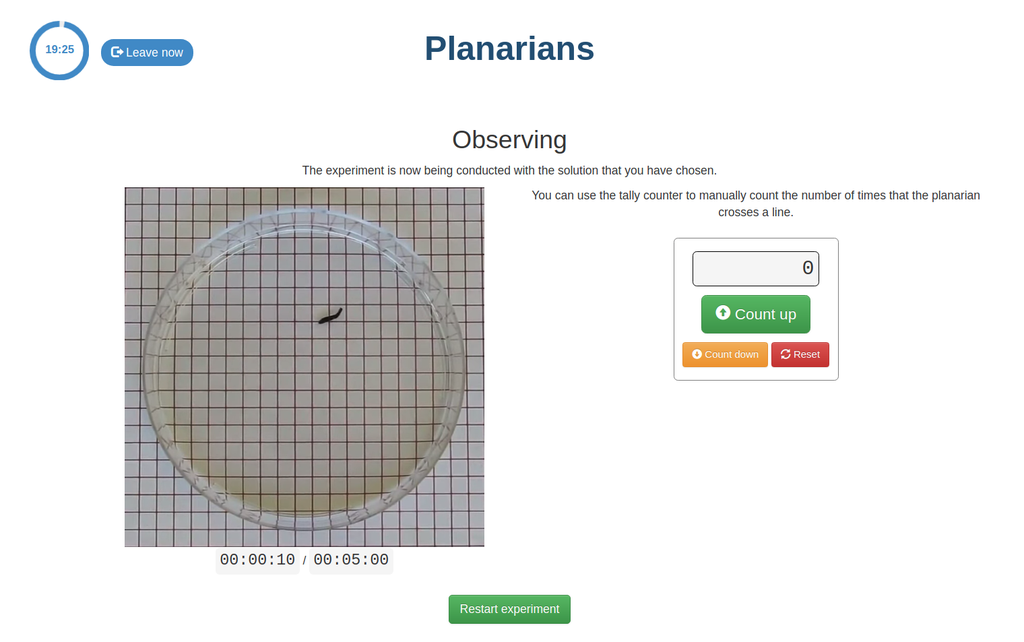
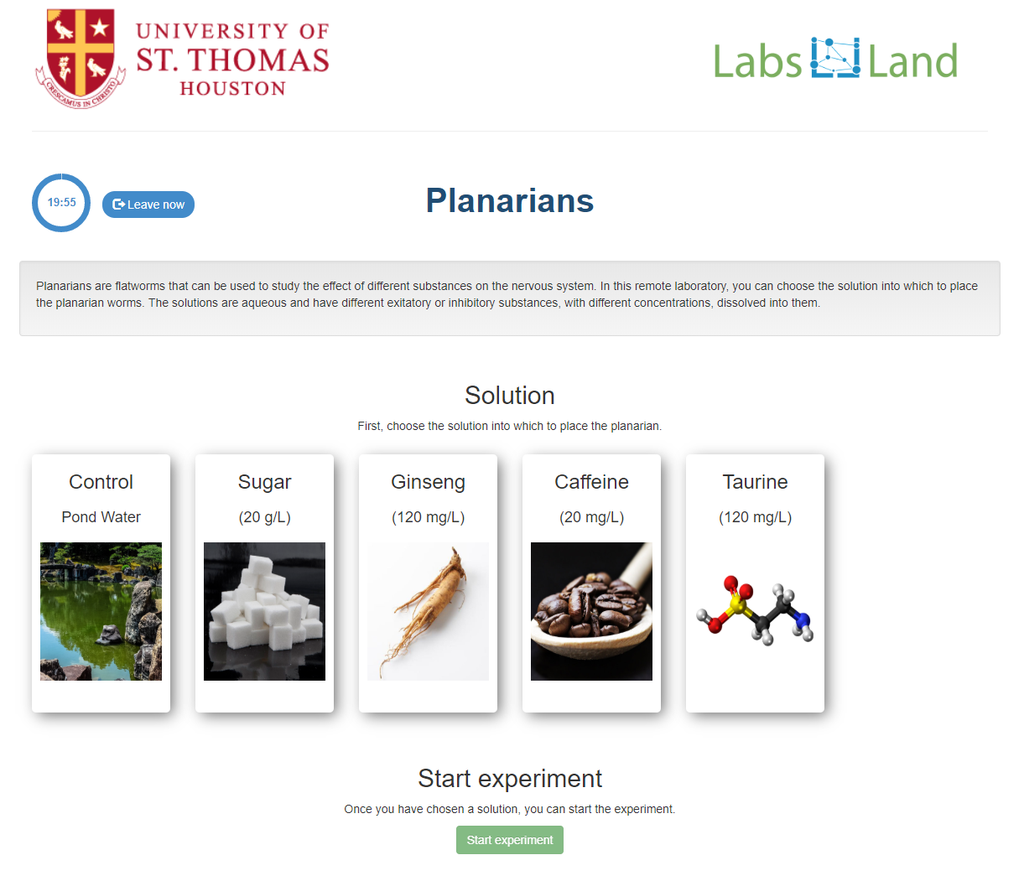
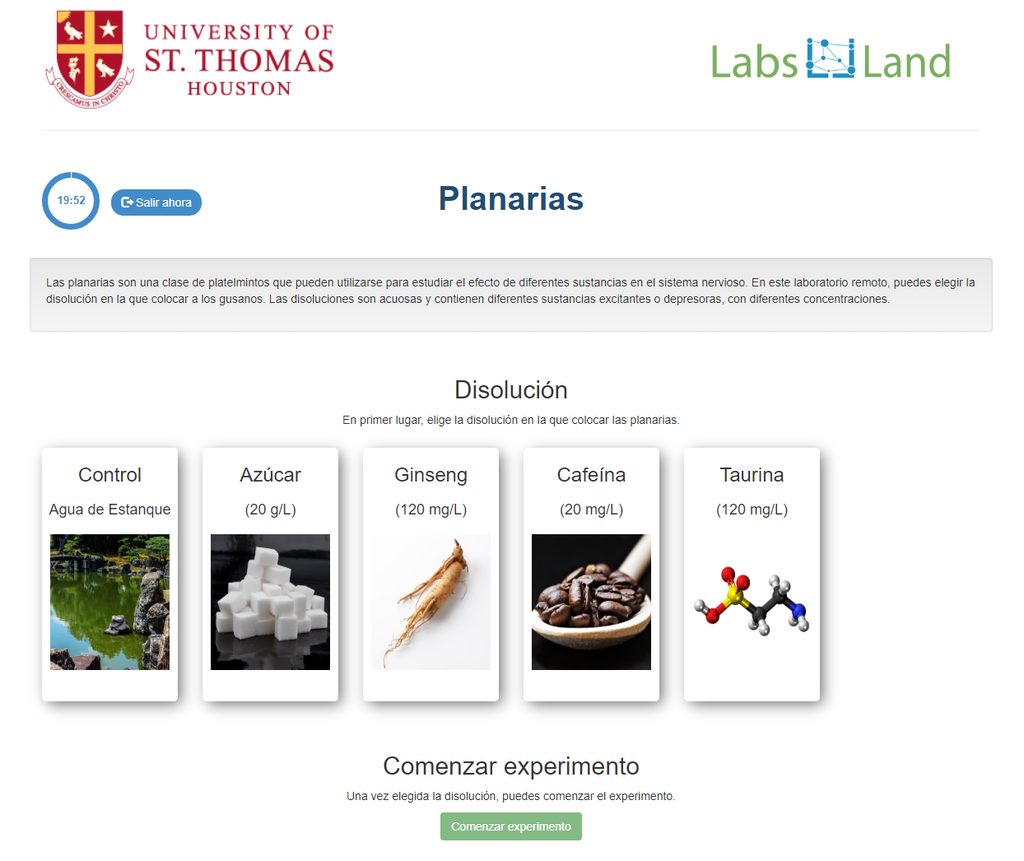
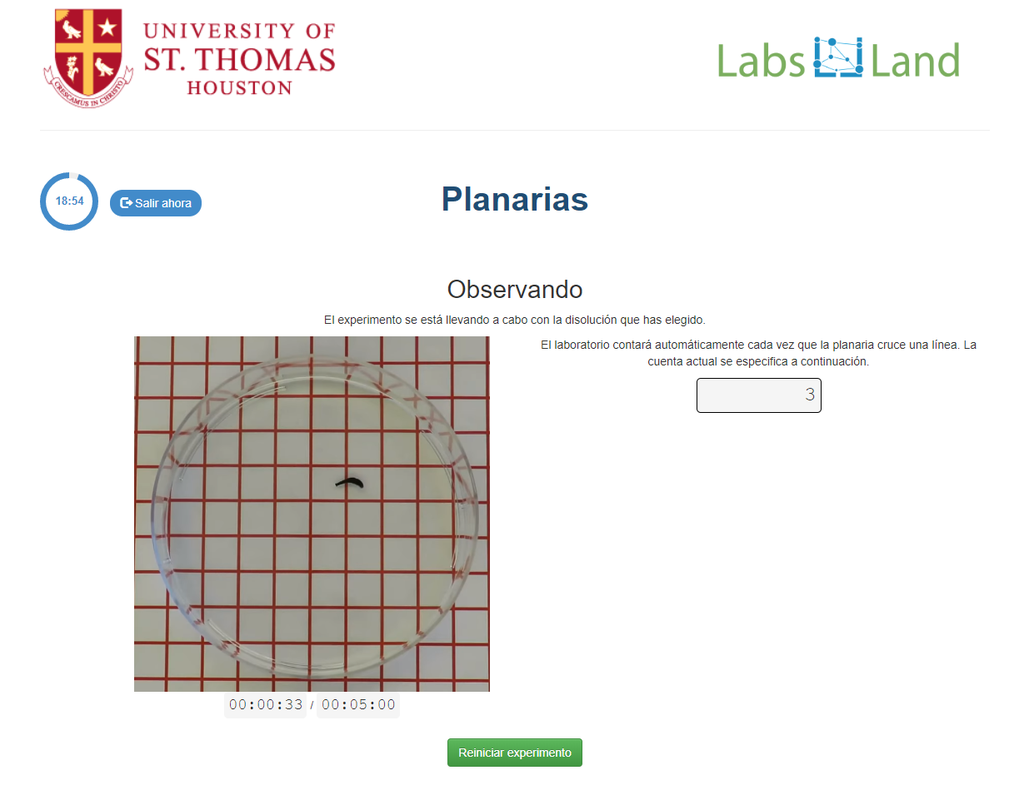
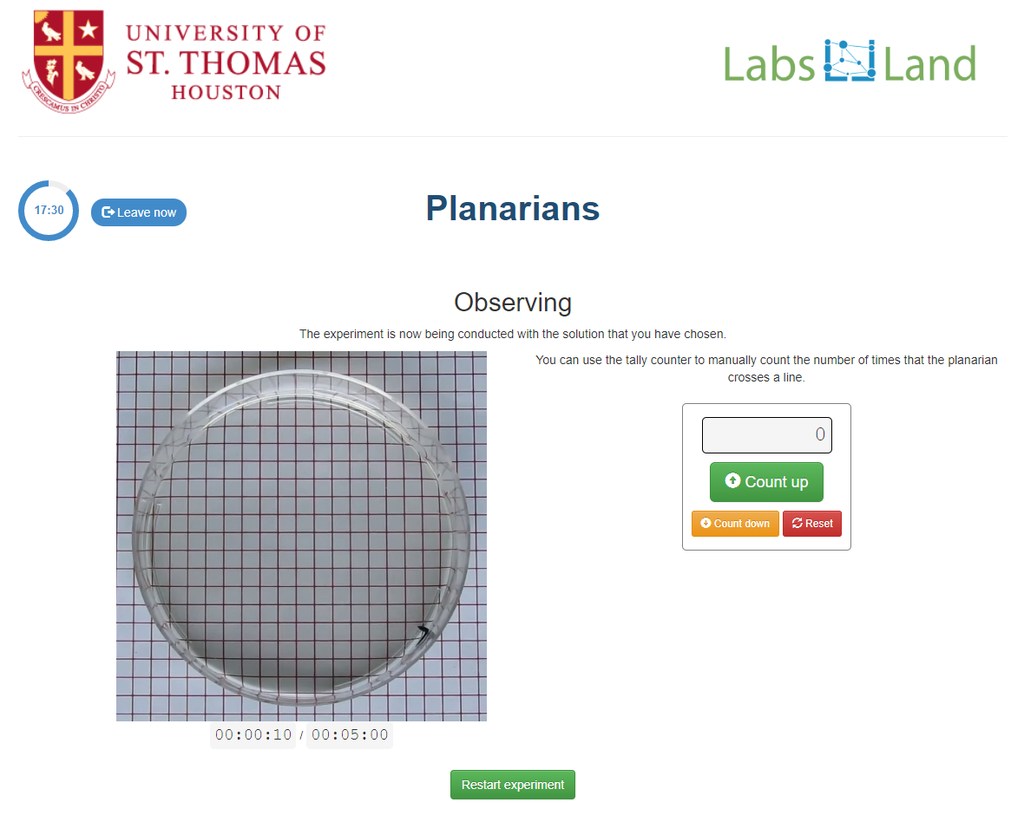
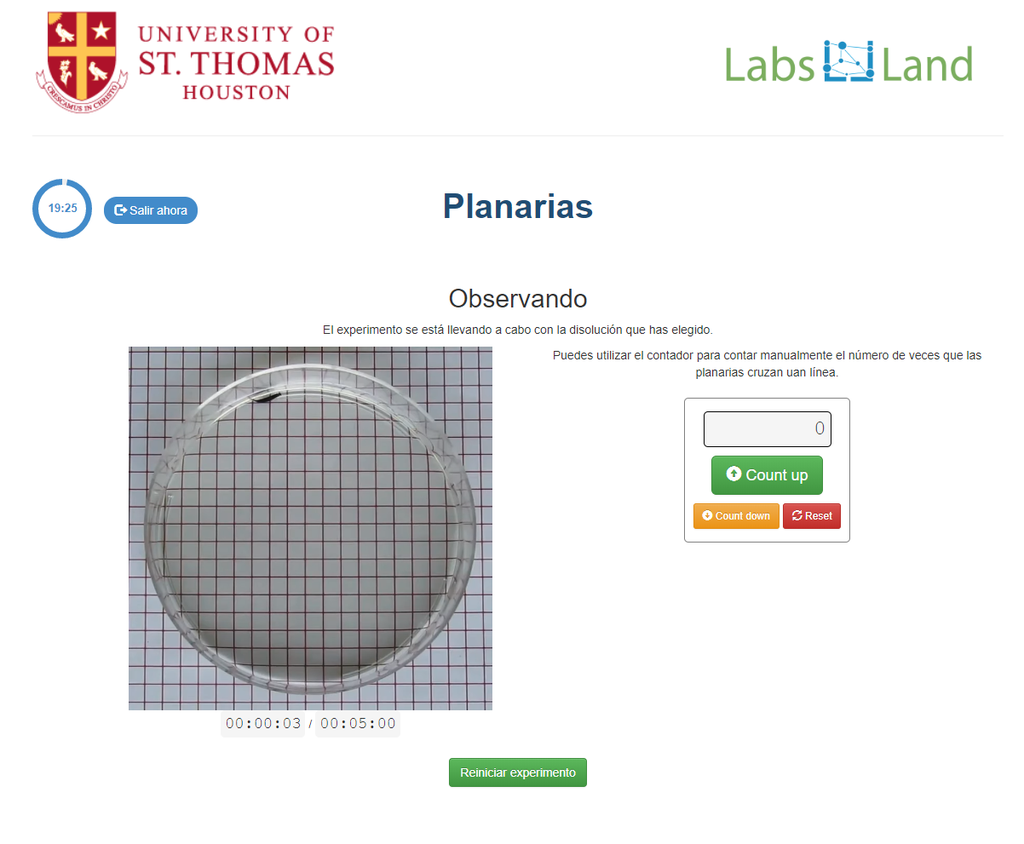
Planarians
Planarians are flatworms that can be used to study the effect of different substances on the nervous system. In this remote laboratory, you can choose the solution into which to place the planarian worms. The solutions are aqueous and have different exitatory or inhibitory substances, with different concentrations, dissolved into them.
In this version of the planarians laboratory there is a manual tally counter that students can use to count the number of times the planarians cross a line (to estimate their activity level).
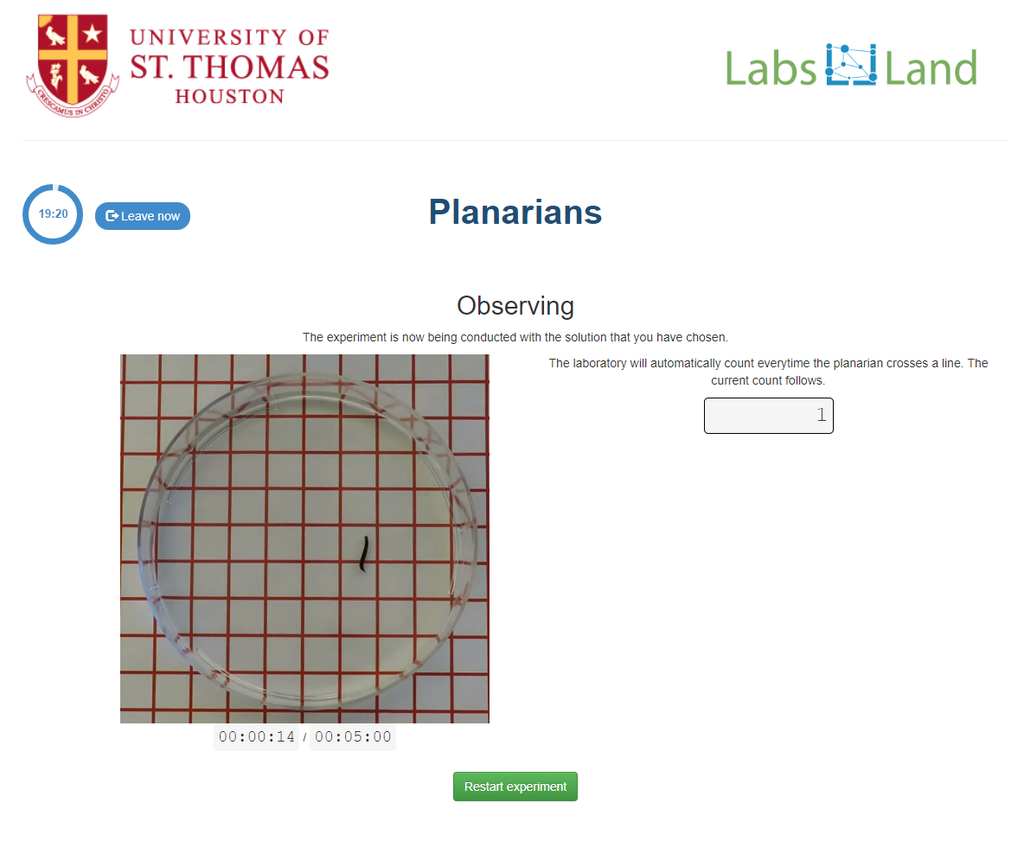
Planarians (automatic)
Planarians are flatworms that can be used to study the effect of different substances on the nervous system. In this remote laboratory, you can choose the solution into which to place the planarian worms. The solutions are aqueous and have different exitatory or inhibitory substances, with different concentrations, dissolved into them.
In this version of the planarians laboratory, the number of times the planarian worms cross the lines is counted automatically.
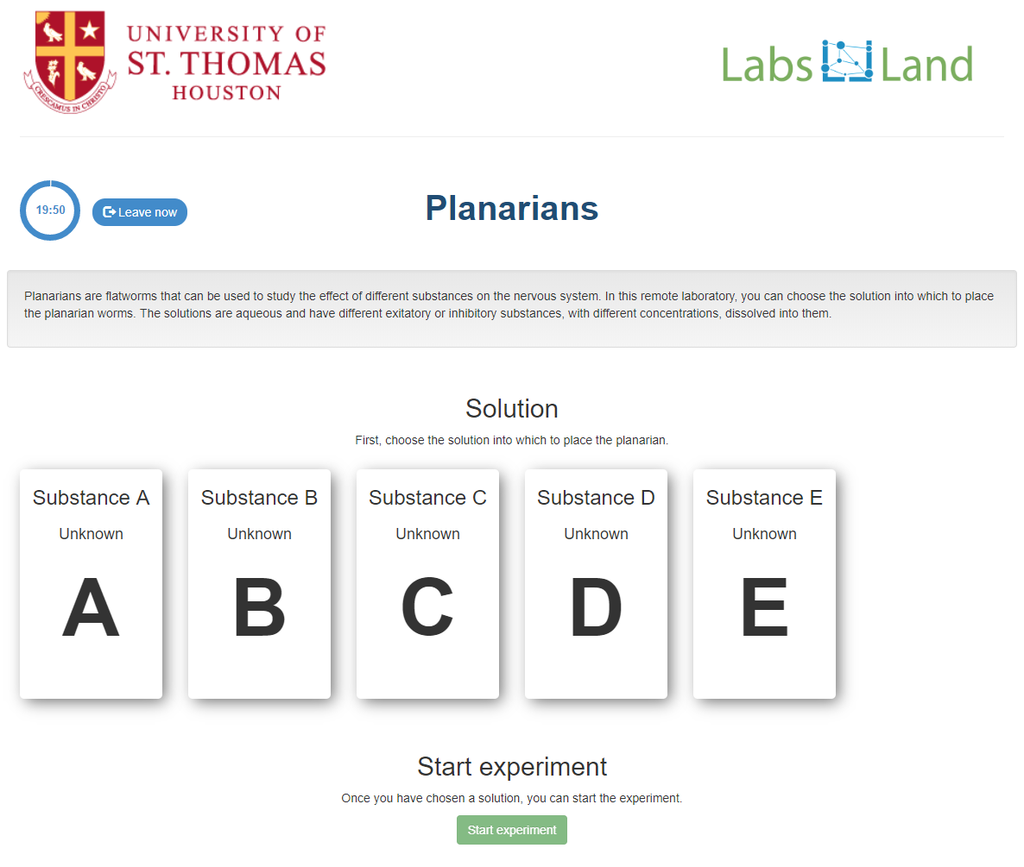
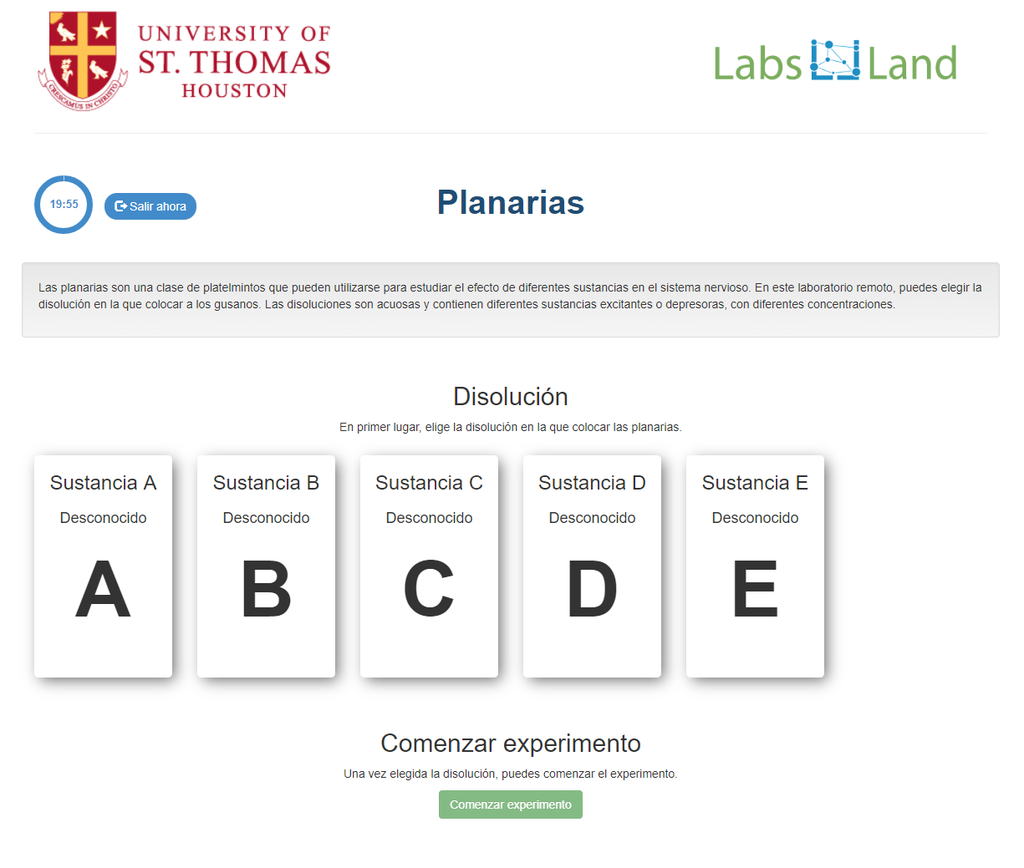
Planarians (guess)
Planarians are flatworms that can be used to study the effect of different substances on the nervous system. In this remote laboratory, you can choose the solution into which to place the planarian worms. The solutions are aqueous and have different exitatory or inhibitory substances, with different concentrations, dissolved into them.
In this version of the laboratory, the names of the substances are not displayed. The challenge can thus be to determine which substance is which, by measuring the activity level of the planarians in each unknown substance.
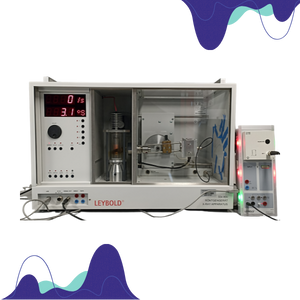
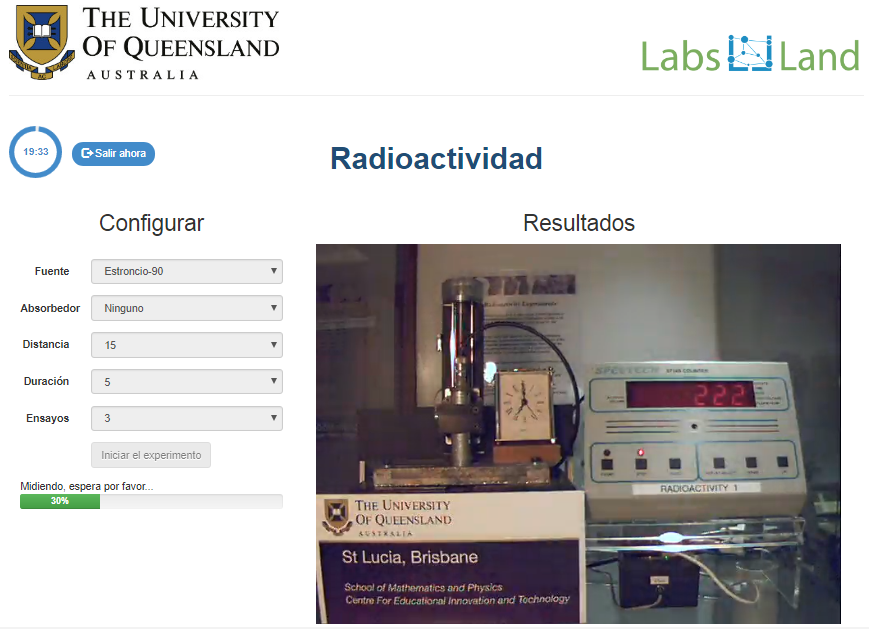
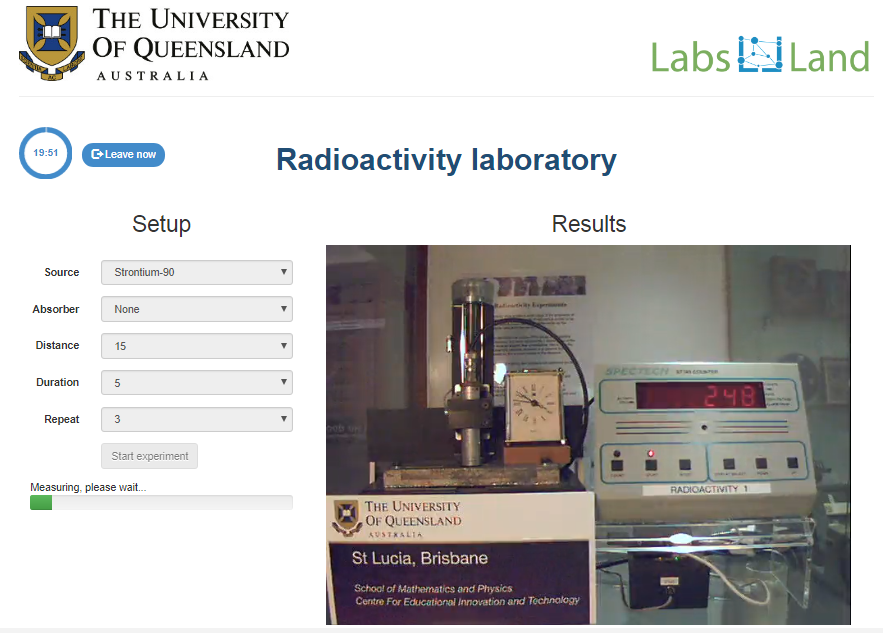
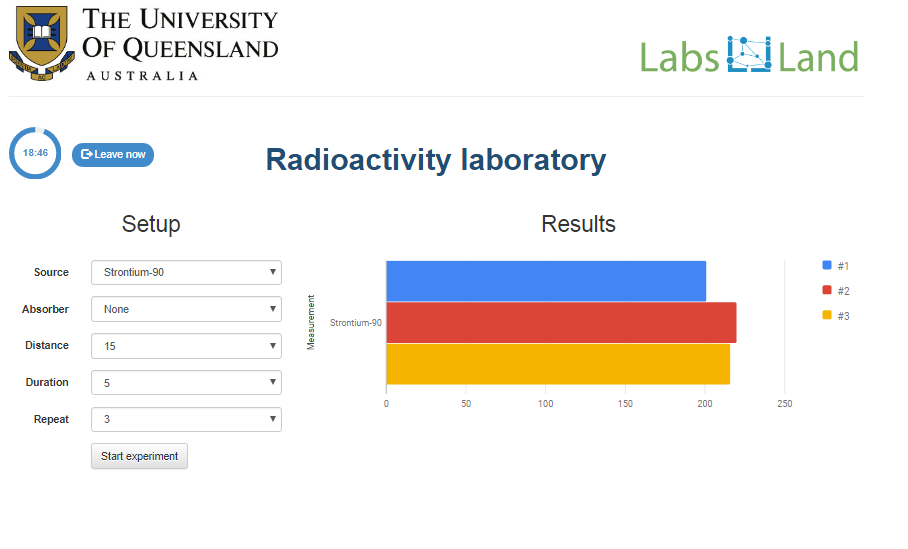
Radioactivity
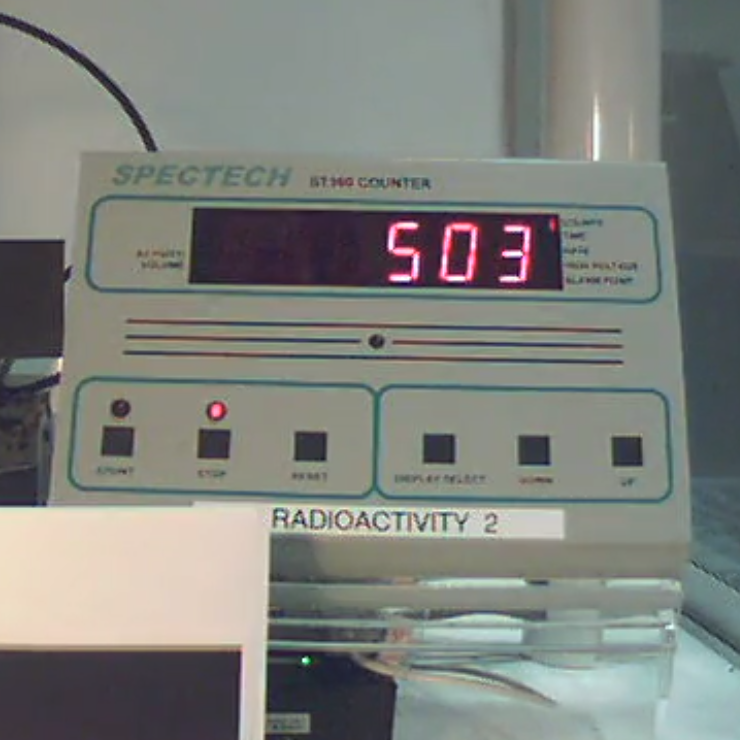
Summary
The setup, useful for schools and universities, includes a Geiger counter that can measure the number of detected particle collisions. The user can choose among different radioactive sources, as well as an absorber to put between the radioactive source and the probe. Additionally, other parameters that users can vary are the distance and number of tests. This allows for a wide range of experiments and learning opportunities.
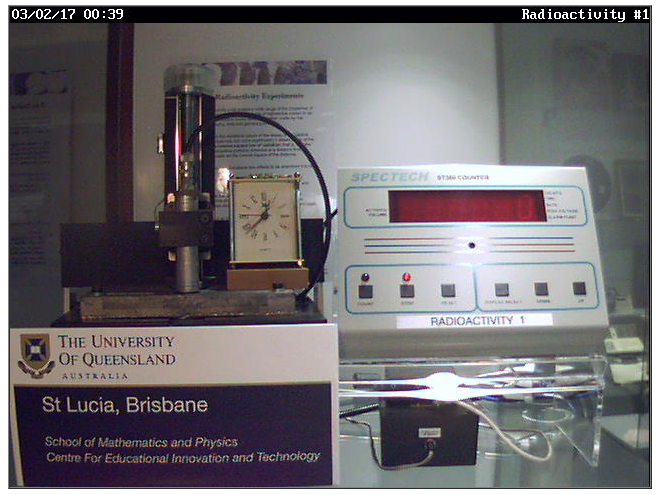
Radioactivity
Radioactivity is the process in which an atomic nucleus loses energy by emitting particles and radiation. This can occur naturally in certain elements, or artificially through the use of nuclear reactions. In the context of physics at schools and universities, studying radioactivity can provide valuable insights into the fundamental nature of matter and the laws of physics.
One common experiment in this area is the measurement of radioactivity using a Geiger counter. This instrument is able to detect the emission of particles from a radioactive source, allowing students to understand the basic principles of radiation and its effects on matter. By varying the type of radioactive source, the distance between the source and the detector, and the type of absorber material placed between the two, students can explore a wide range of phenomena and gain a deeper understanding of the underlying principles.
In addition to its educational value, studying radioactivity also has practical applications in fields such as medicine, energy production, and environmental protection. As such, it is an important topic for students to learn about, both for its intrinsic interest and for the many real-world applications it has.
Real-world applications of radioactivity
One of the most common applications of radioactivity is in the field of medicine. Radioactive isotopes are used in medical imaging techniques such as PET and SPECT scans, which allow doctors to see inside the body and diagnose diseases. Radioactive isotopes are also used in cancer treatments, such as radiotherapy, where they are used to kill cancer cells.
Radioactivity is also used in industries such as oil and gas exploration, where it is used to measure the permeability of rock formations and the flow of fluids through them. Radioactive isotopes are also used in smoke detectors and in the production of luminous watches and instruments.
Overall, radioactivity has a wide range of applications in fields such as medicine, industry, and even everyday consumer products. It continues to be an important area of study in physics and other sciences, and its uses continue to expand as new technologies are developed.
Radioactivity experiments at schools and universities
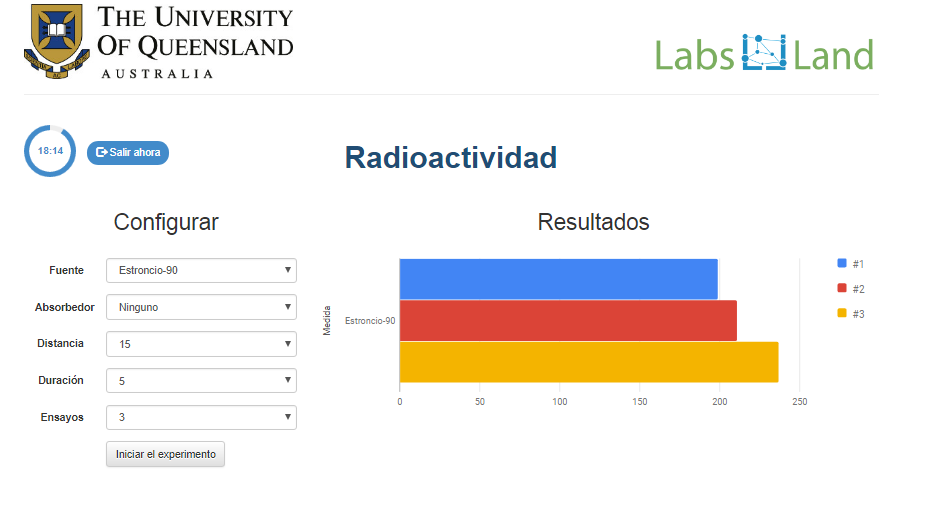
The use of a geiger counter in a radioactivity experiment allows for a wide range of possibilities. By varying the radiation emitters and absorbers, students can observe the effects of different sources and materials on the detected particle collisions. This can help students understand the properties of radioactivity and the behavior of different particles.
Additionally, experiments involving the determination of the type of particle being radiated can be conducted by observing whether the particle is absorbed or not. By placing different absorbers between the source and the probe, students can determine the properties of the emitted particles and gain a deeper understanding of radioactivity.
Lastly, experiments involving the determination of the geometric form of radioactivity emission can also be conducted using a geiger counter. By carefully measuring the detected particle collisions at different distances, students can gain insights into the spatial distribution of radioactivity. This can help students understand the fundamental principles of radioactivity and its applications in the real world.
Potential learning objectives
Potential objectives of activities conducted with the laboratory are the following:
- Understand the properties and behavior of radioactive emissions.
- Conduct experiments to measure the effects of radiation on various materials.
- Determine the type of radiation emitted by a radioactive source.
- Understand the principles of radiation safety and handling.
- Investigate the applications of radioactivity in fields such as medicine, industry, and research.
- Understand the principles of Geiger counters and their use in measuring radioactivity.
- Understand the historical development of the concept of radioactivity and its discovery.
- Explore the ethical implications of the use of radioactive materials.
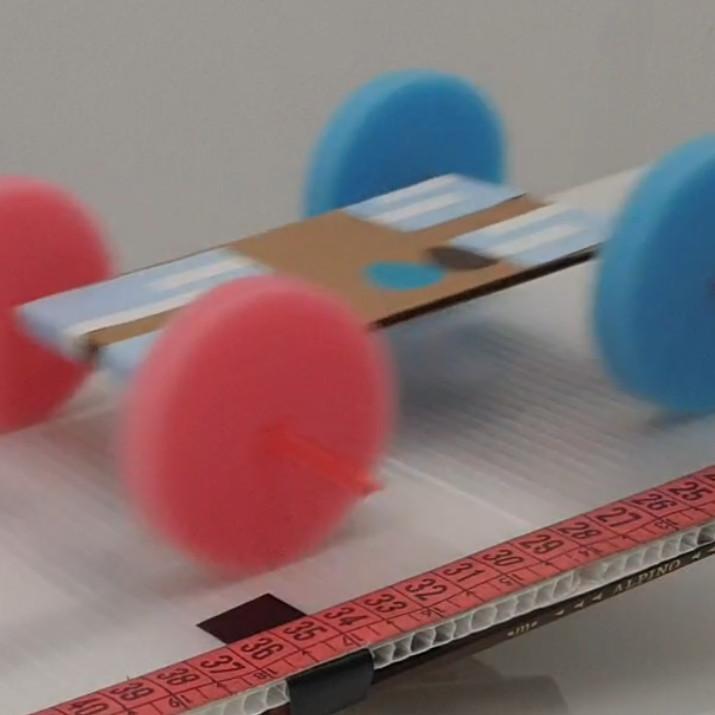
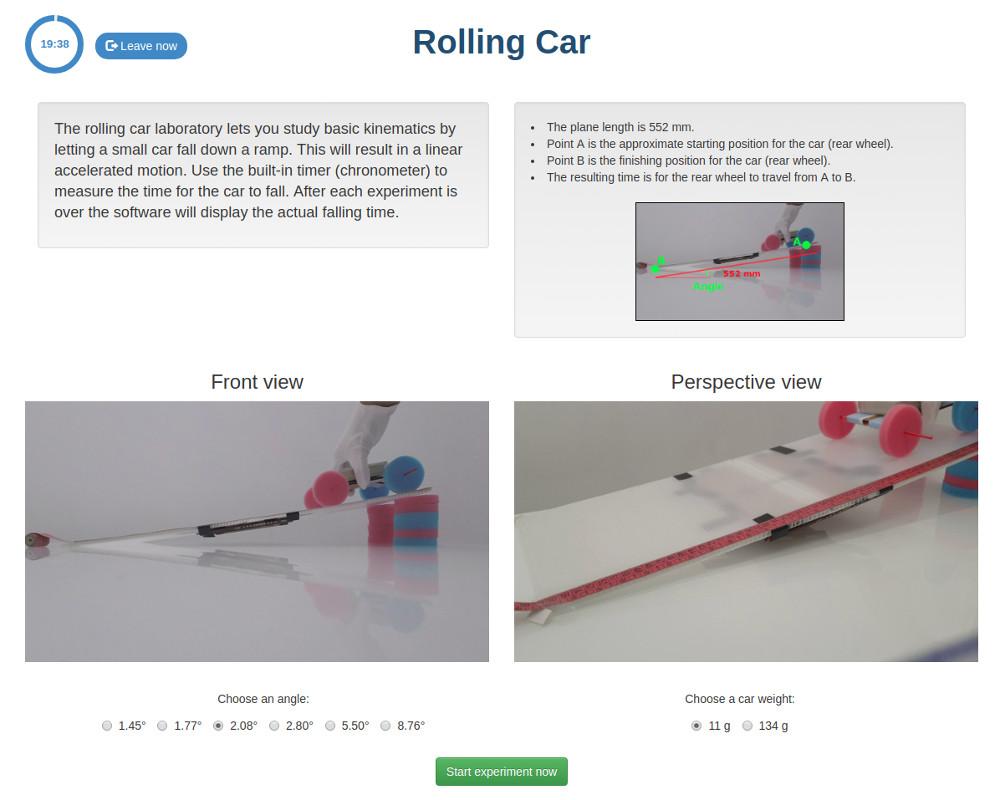
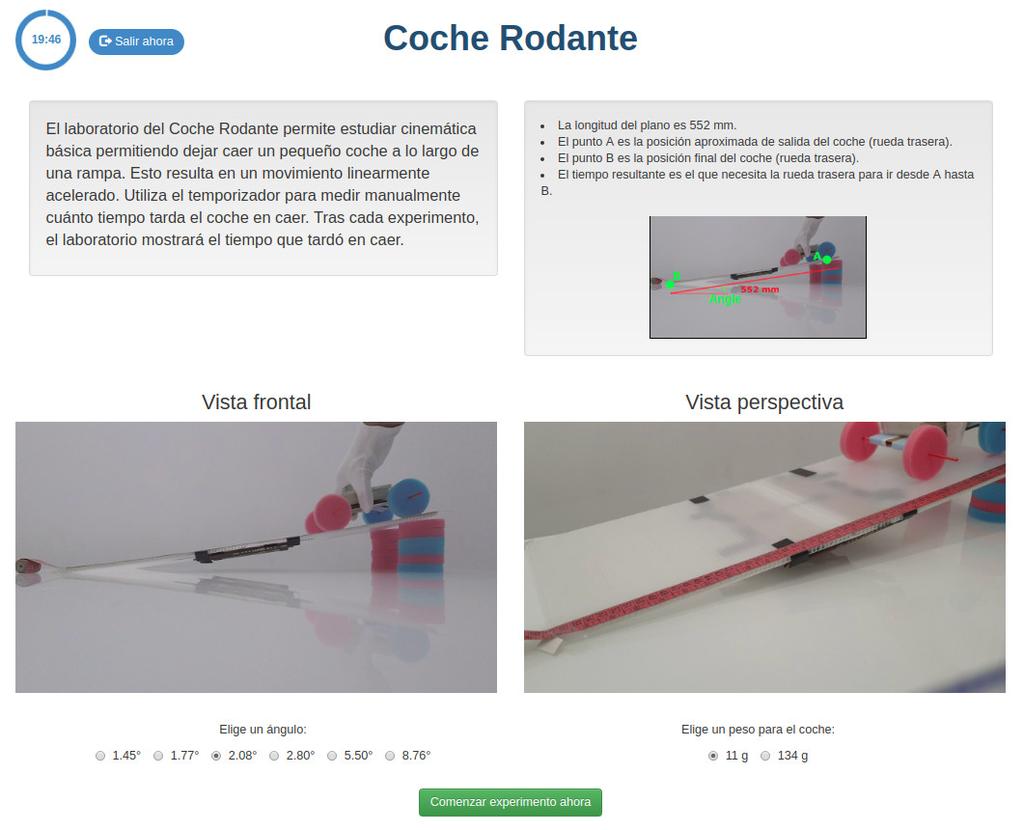
Rolling Car
The rolling car laboratory lets you study basic kinematics by letting a small car fall down a ramp. This will result in a linear accelerated motion. You can use the built-in timer to measure yourself how much time the car takes to fall. Alternatively, after each experiment is over, the software will tell you the time it took.

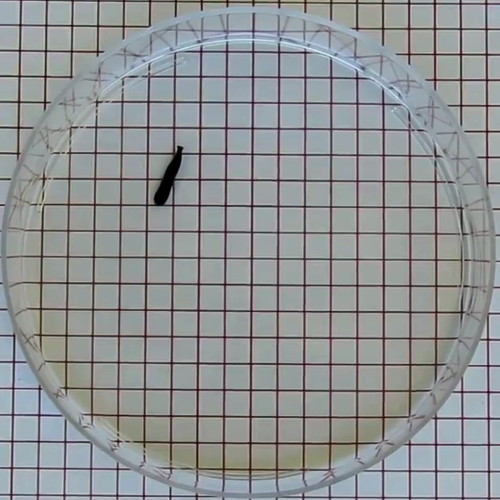
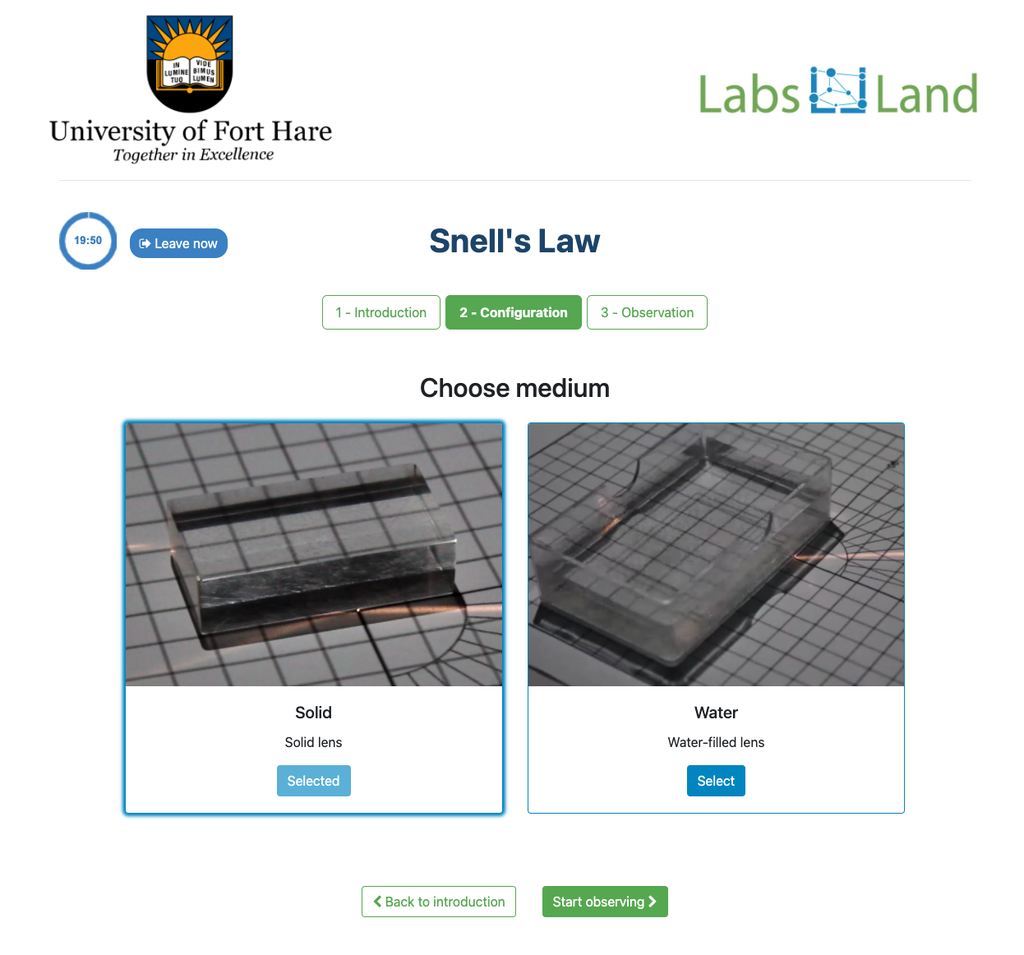
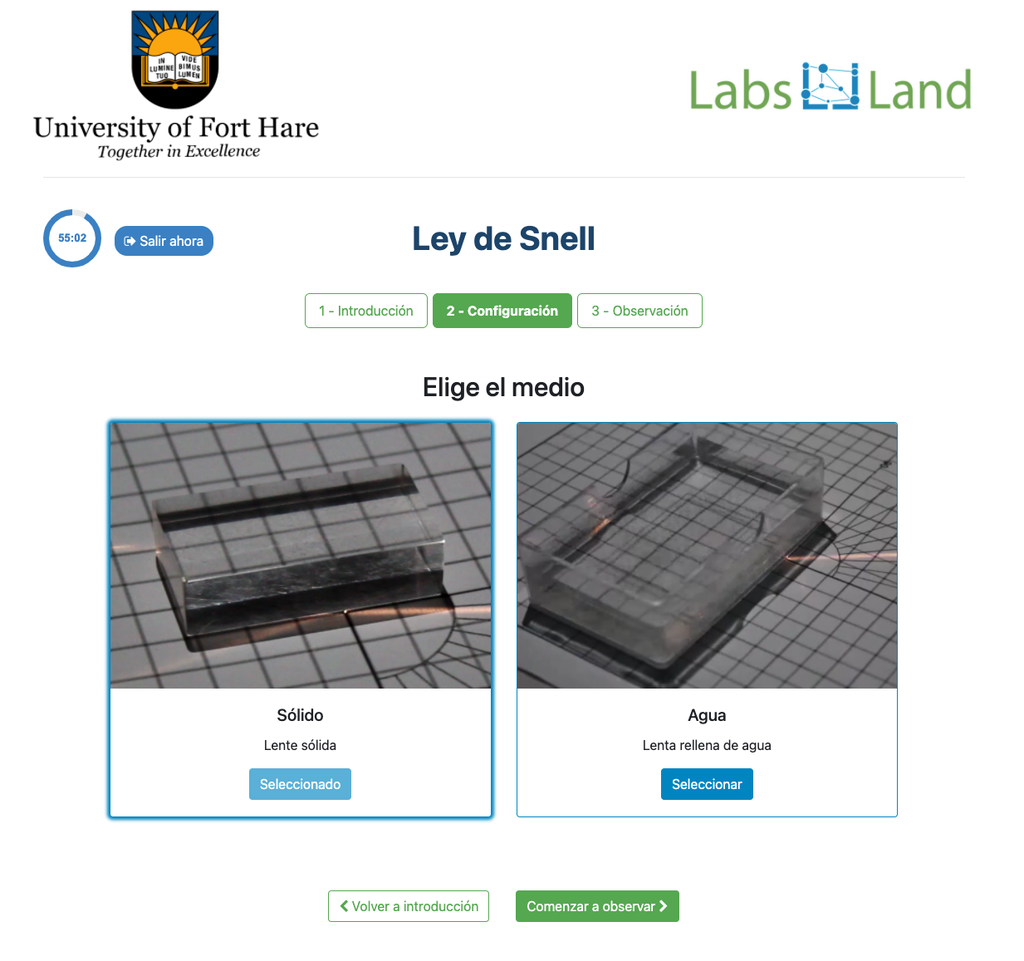
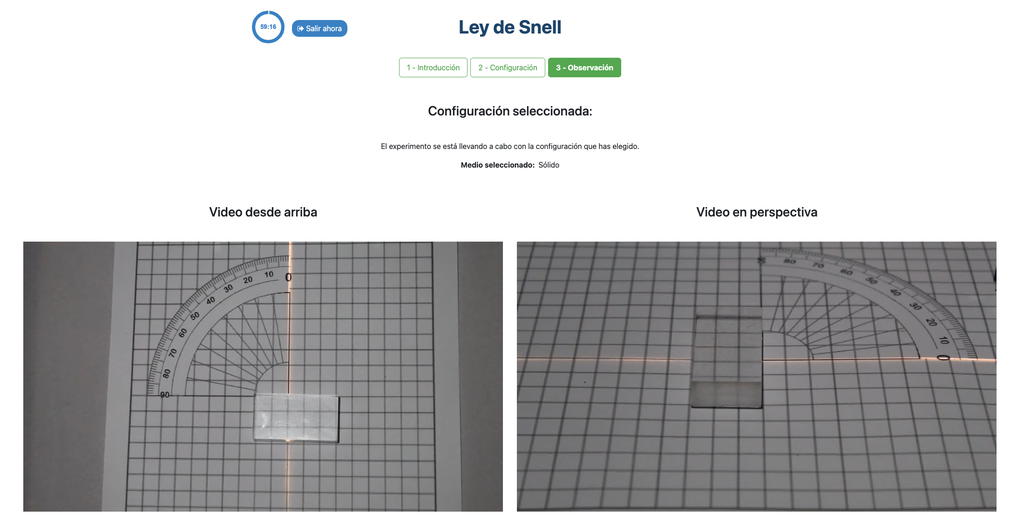
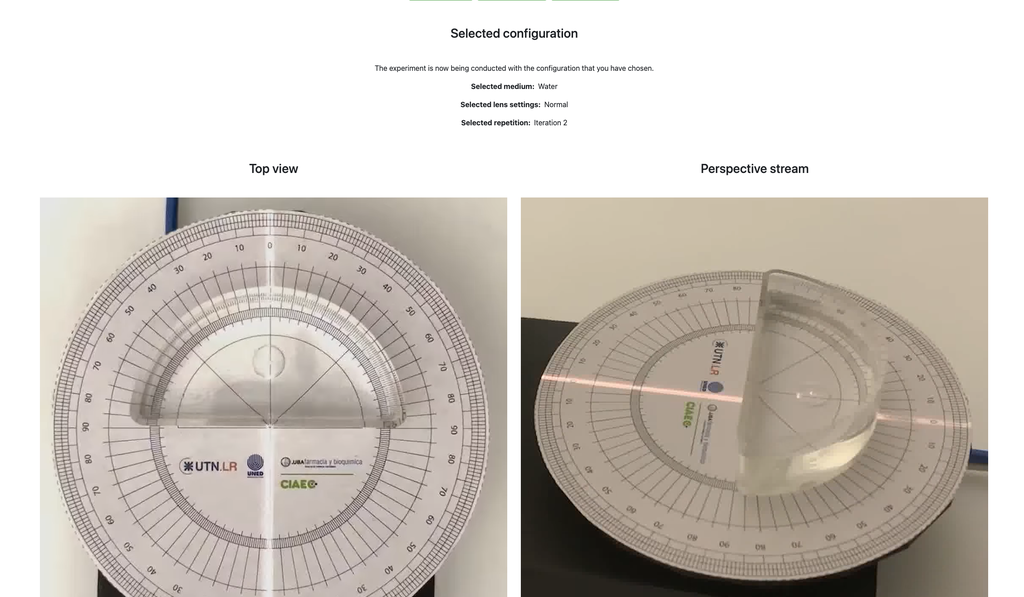
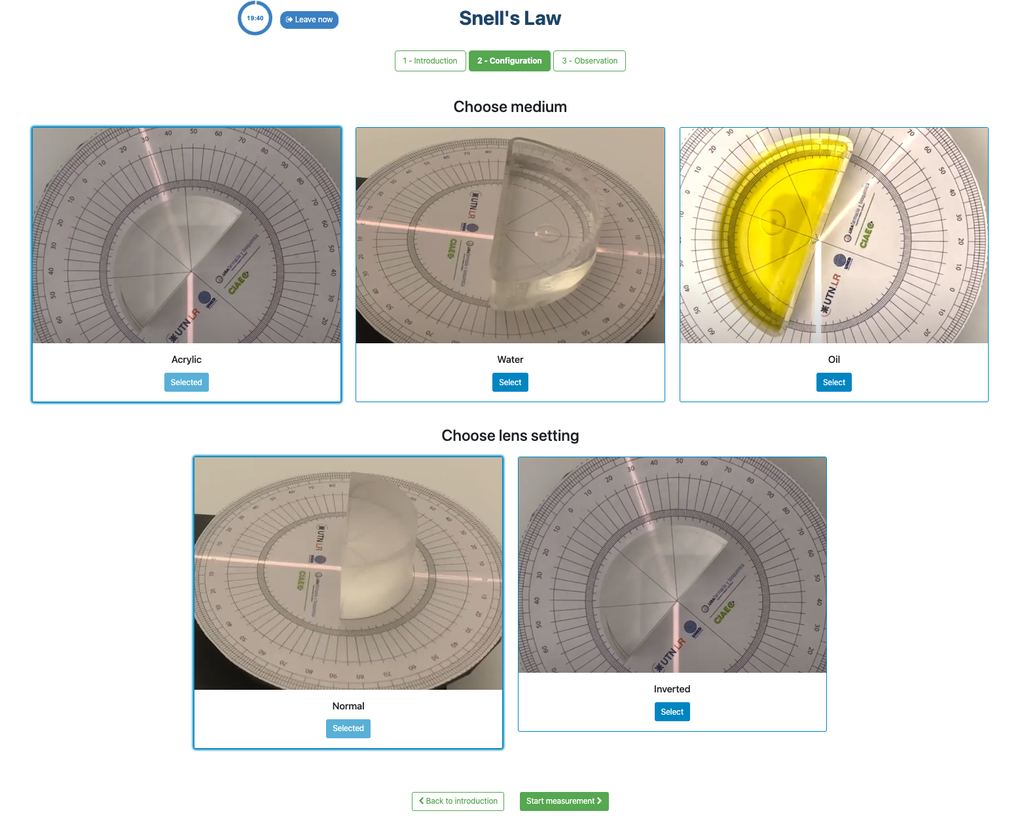
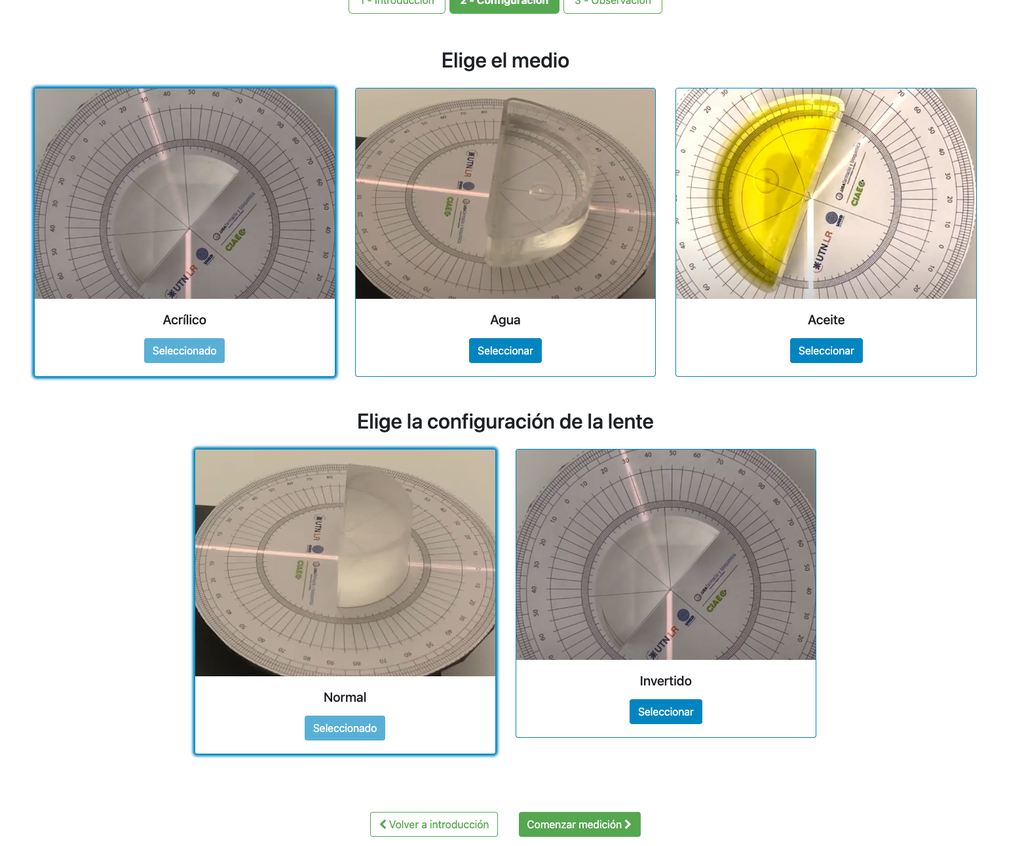
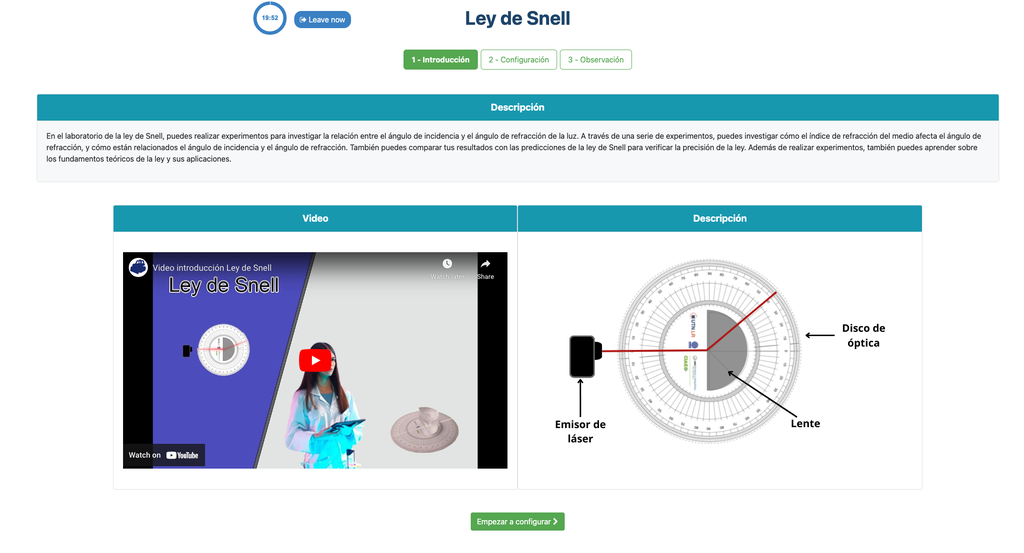
Snell's Law
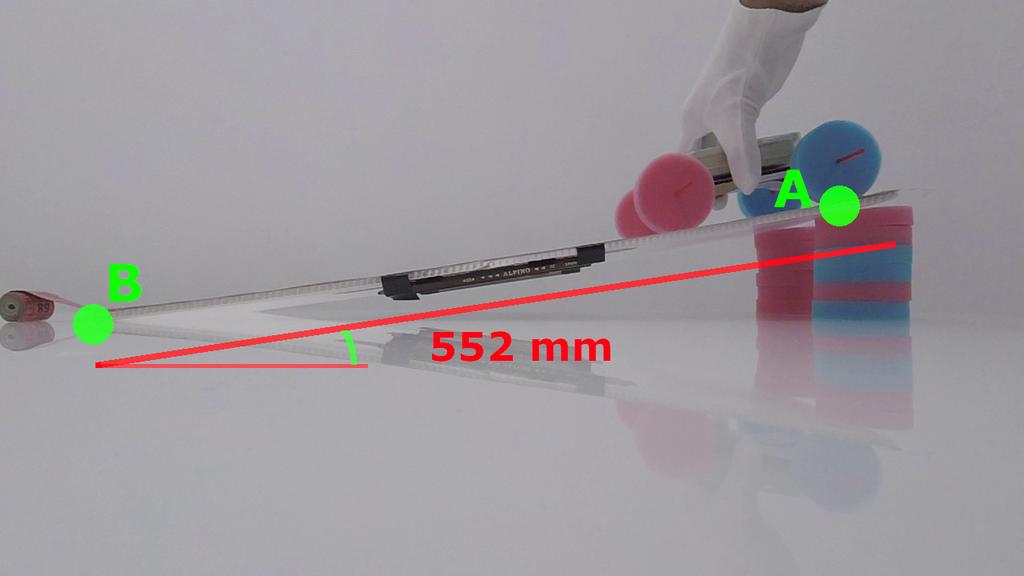
Snell's law (the law of refraction) is a formula used to describe the relationship between the angles of incidence and refraction, when referring to light or other waves passing through a boundary between two different isotropic media, such as water, glass, or air.
In this laboratory you can experiment with several lenses to find the refractive indices of different materials using this law.
In this version of the laboratory students will have to measure by themselves using the squares grid. The refraction angle is not given to them. An alternative version of the laboratory is available in which a verification stage is available with the resulting refraction angle. See "Snell's Law with verification" for that version.

Snell's Law (II)
Snell's law (the law of refraction) is a formula used to describe the relationship between the angles of incidence and refraction, when referring to light or other waves passing through a boundary between two different isotropic media, such as water, glass, or air. In this laboratory you can experiment with several lenses to find the refractive indices of different materials using this law. In this version of the laboratory students will have to measure by themselves using the squares grid. The refraction angle is not given to them. An alternative version of the laboratory is available in which a verification stage is available with the resulting refraction angle. See "Snell's Law with verification" for that version.

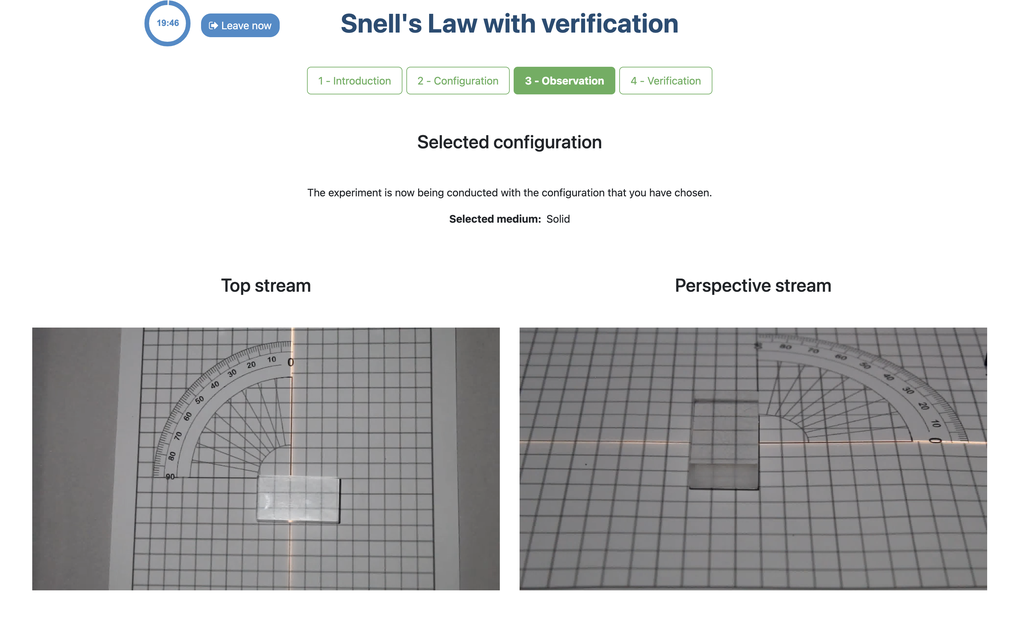
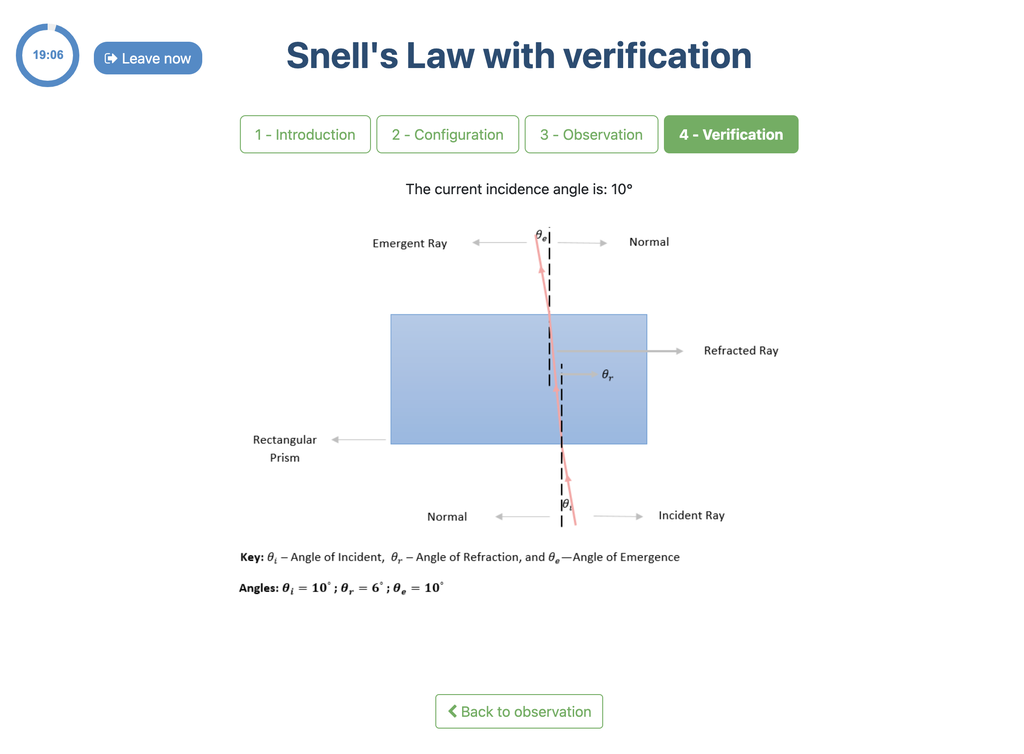
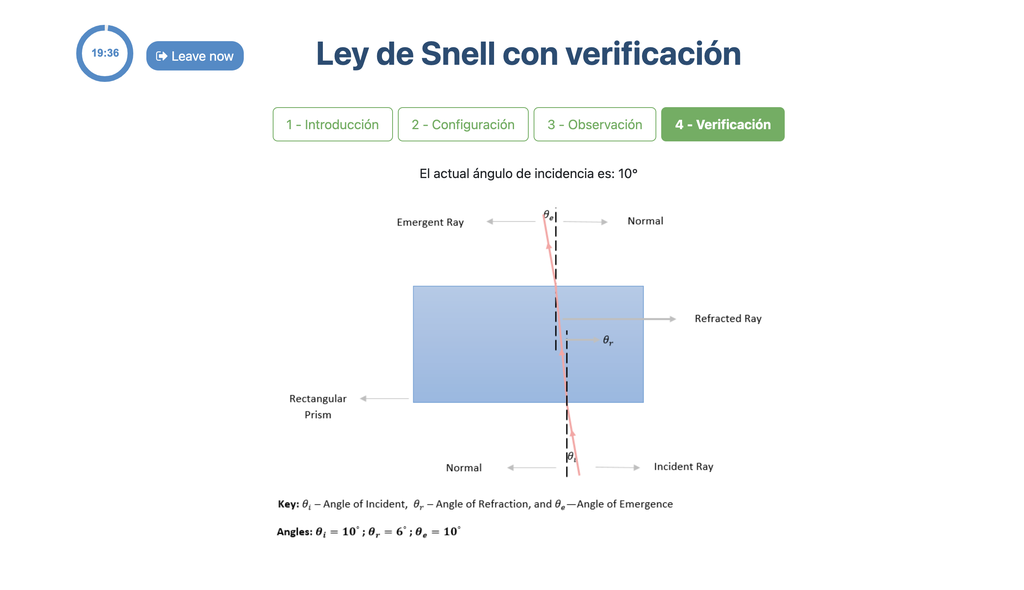
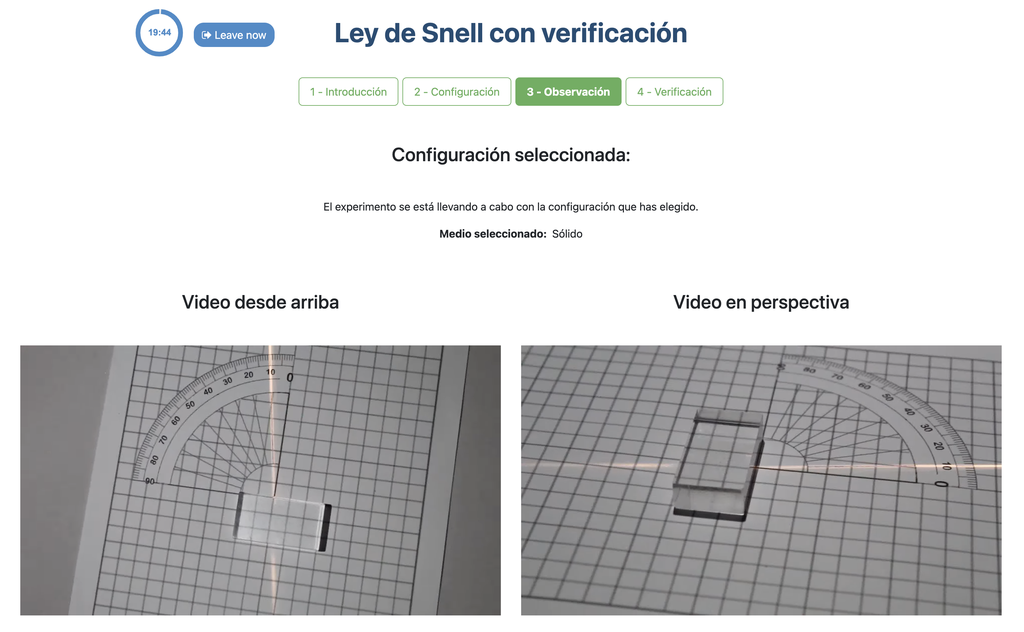
Snell's Law with verification
Snell's law (the law of refraction) is a formula used to describe the relationship between the angles of incidence and refraction, when referring to light or other waves passing through a boundary between two different isotropic media, such as water, glass, or air.
In this laboratory you can experiment with several lenses to find the refractive indices of different materials using this law.
In this version of the laboratory there is a verification stage in which students can see the solution with the measurements for a given experimental setup. If students shouldn't be able to see the solution, see the alternative "Snell's Law" version of the laboratory instead (without verification).
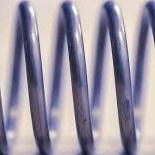
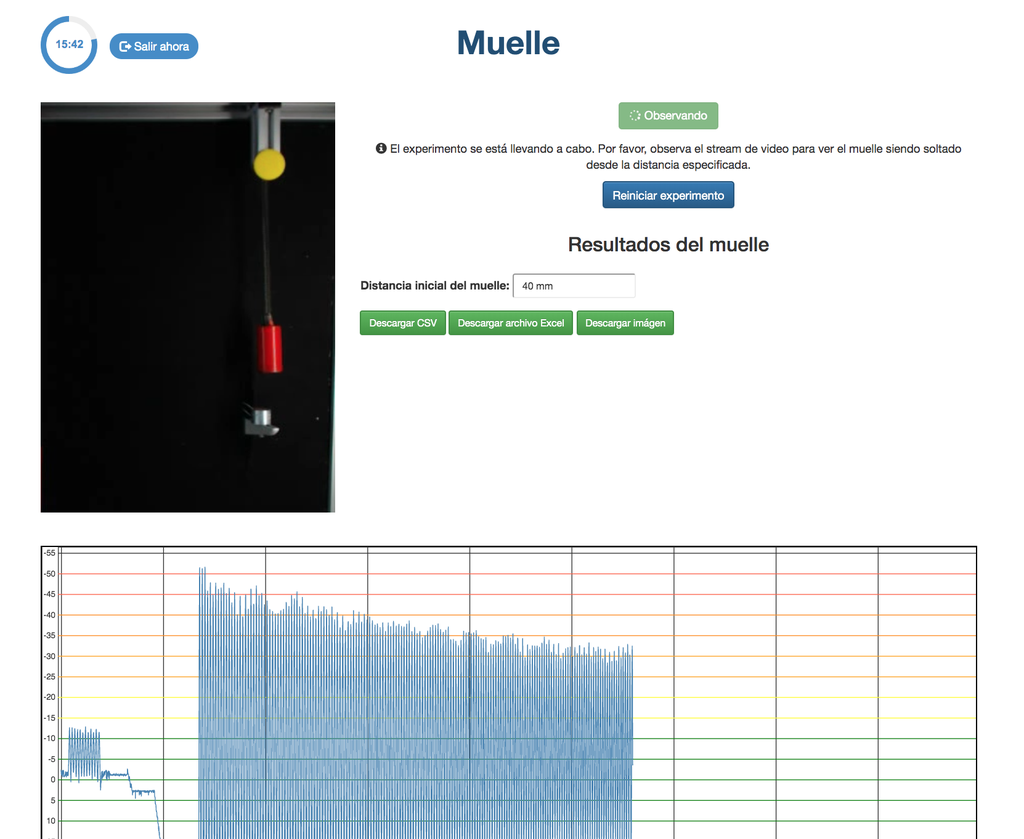
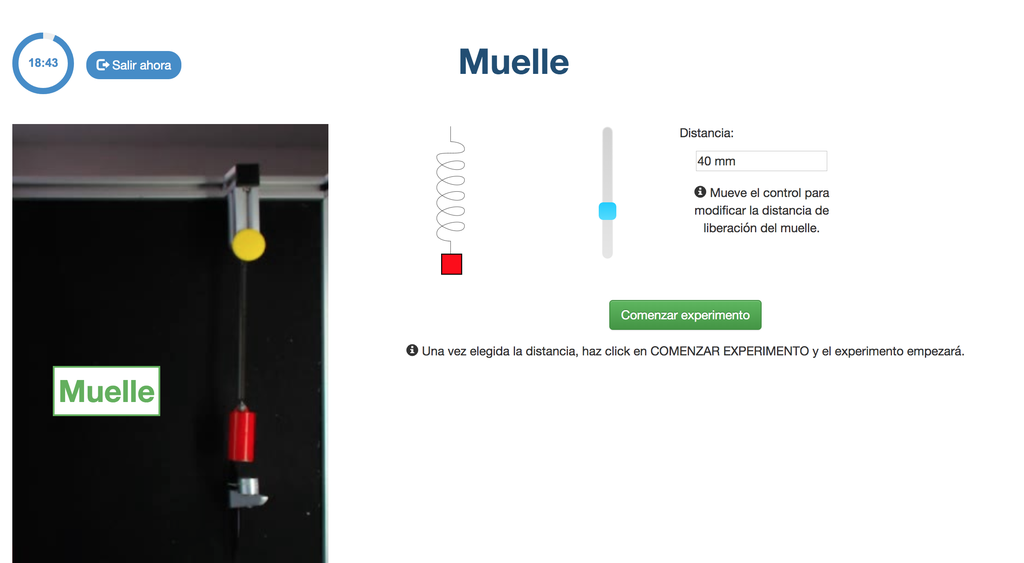
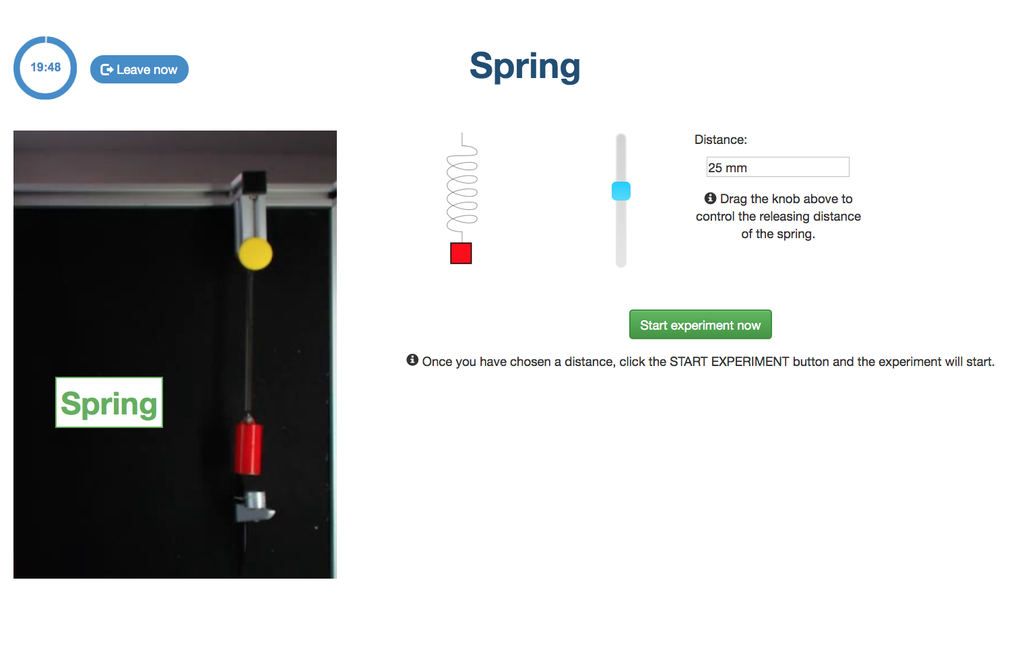
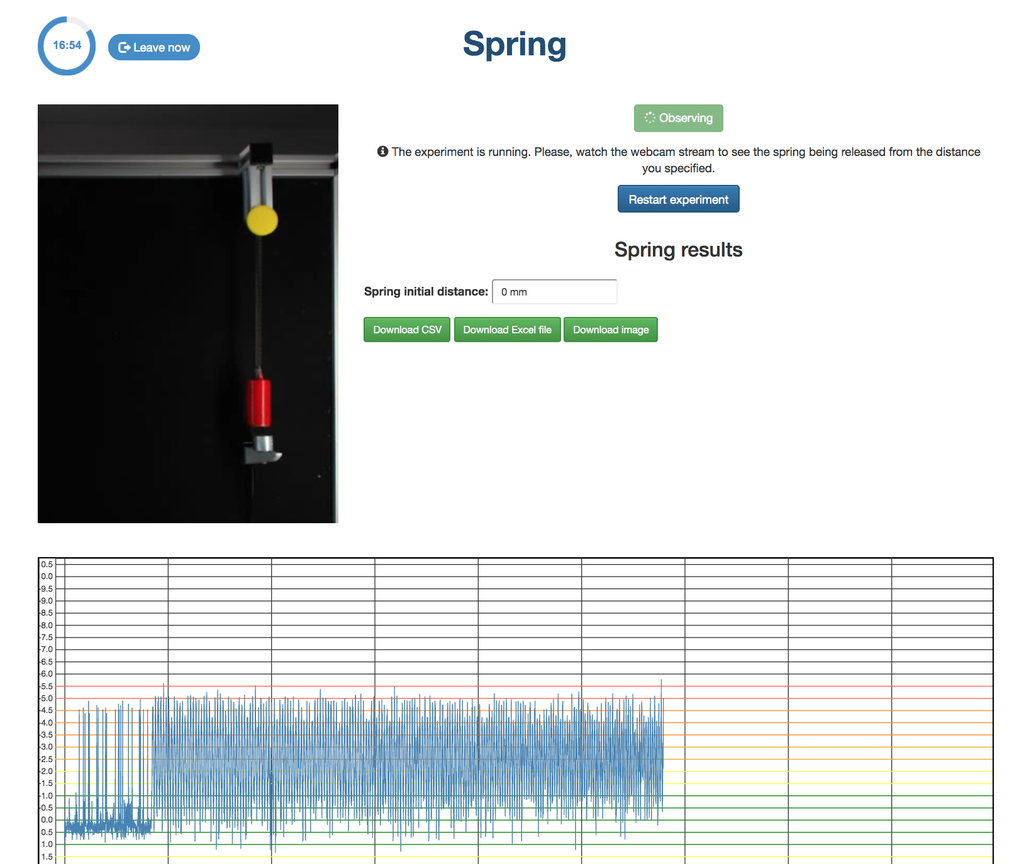
Spring
With this lab, you can control the distance to which to move a spring, and see and measure its behavior once it is released. This experiment will provide you a set of real data that you can use to analyze the behavior of the spring depending on the distance, the time, and other variables.
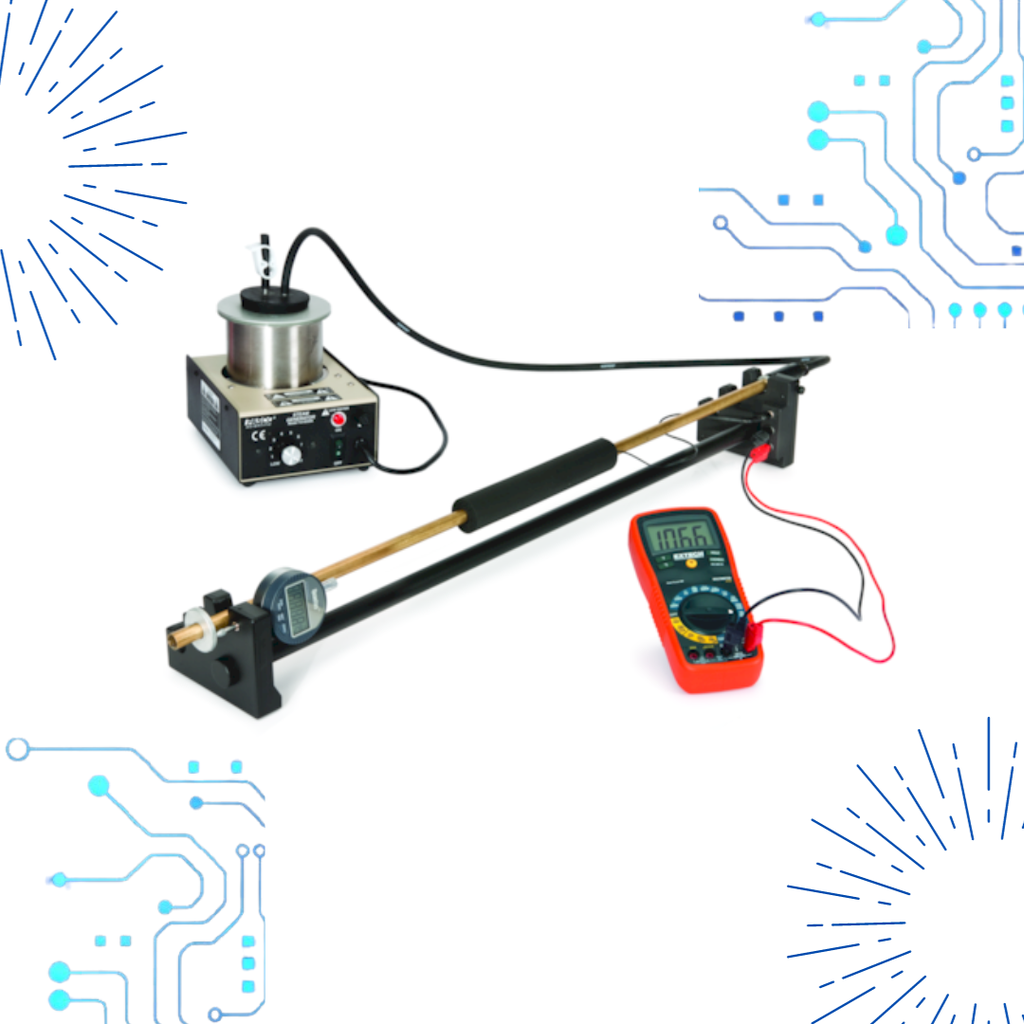
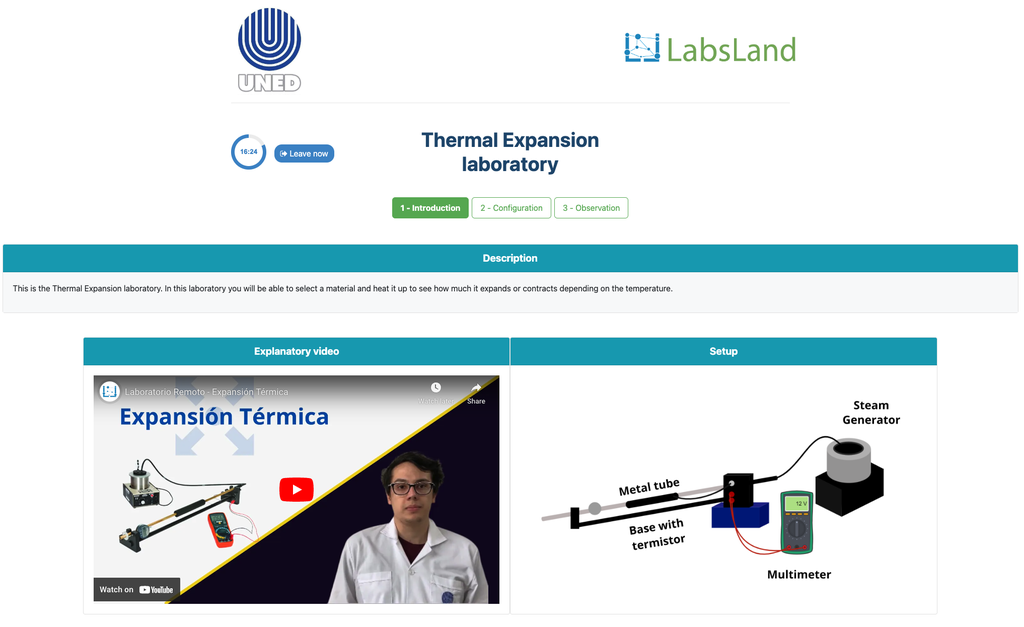
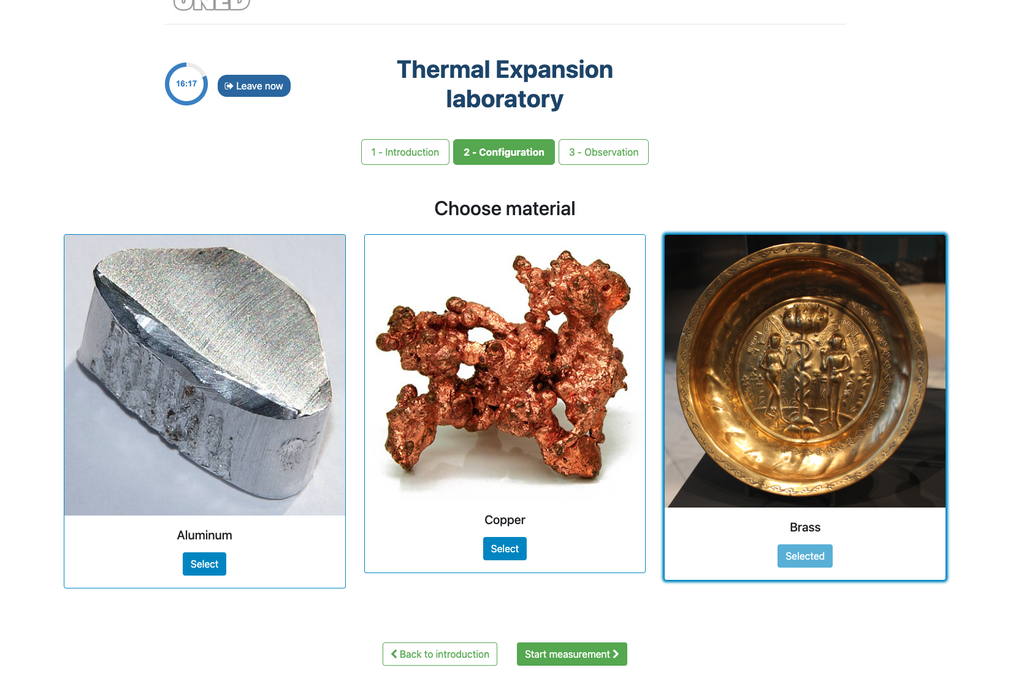
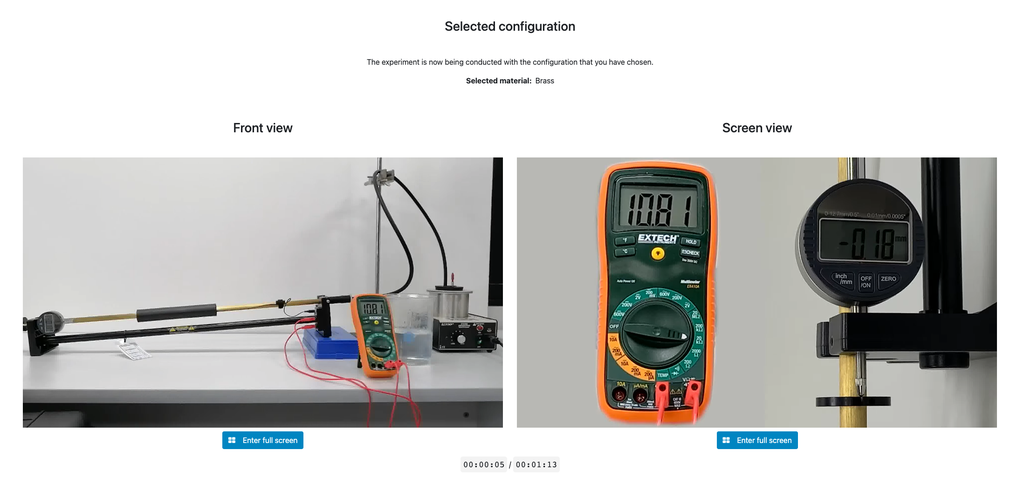
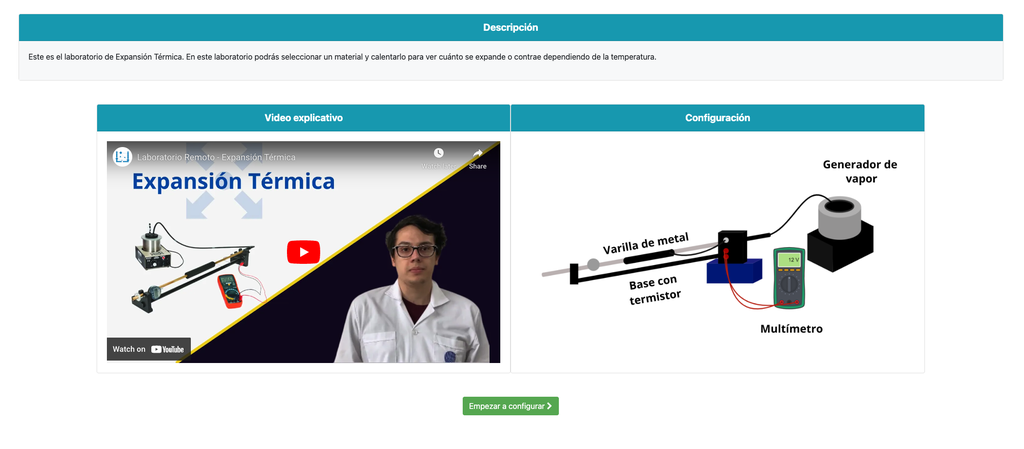
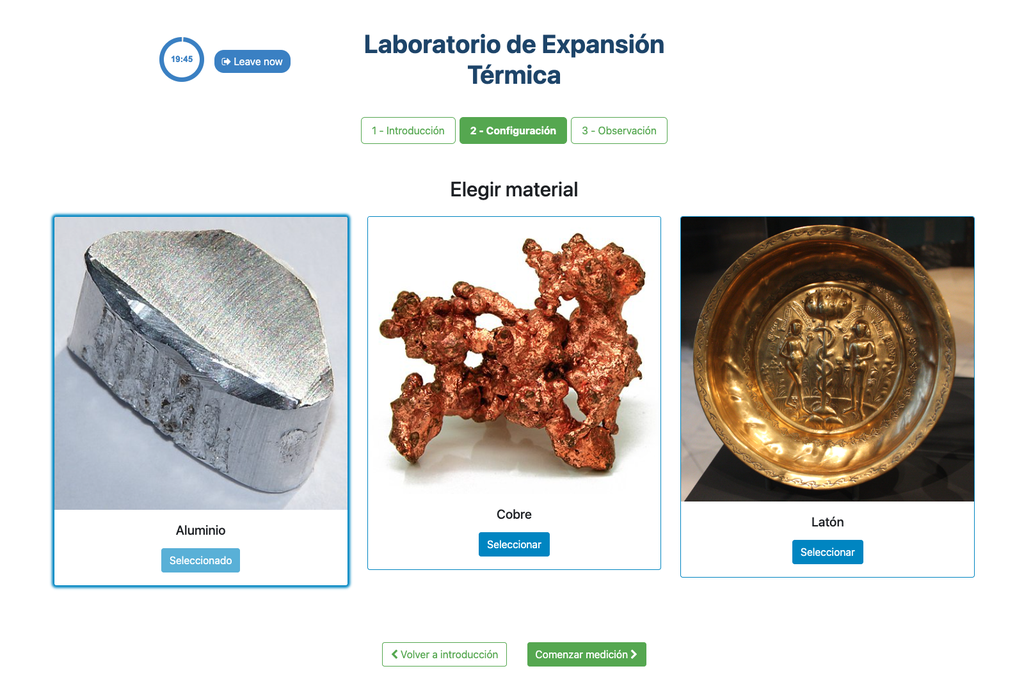
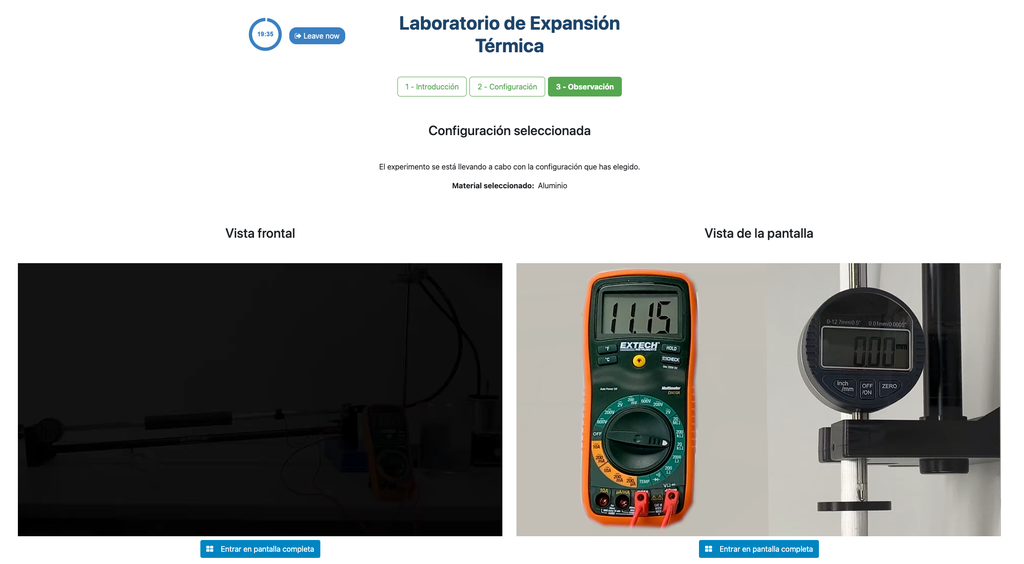
Thermal Expansion
In this remote lab, students can select from three different materials—copper, brass, or aluminum. They can then apply heat to their chosen material and observe the resulting thermal expansion. This interactive lab allows students to explore the principles of thermal expansion in real-time, enhancing their understanding of how different materials react to heat. With precise control and detailed measurements, this lab provides a hands-on learning experience, accessible from anywhere, fostering deeper insights into material science and thermodynamics.
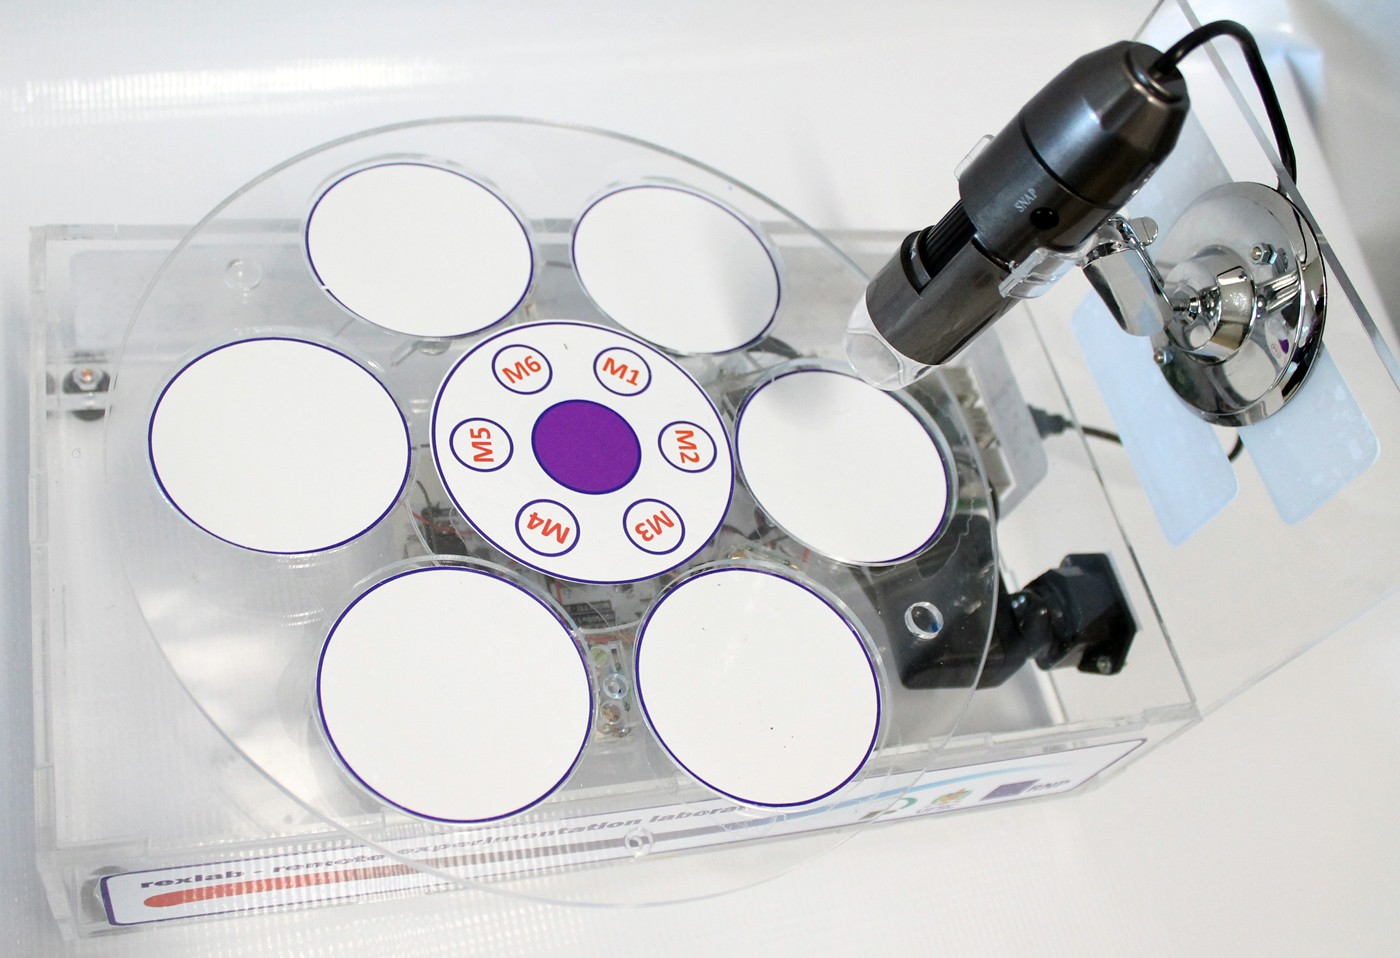
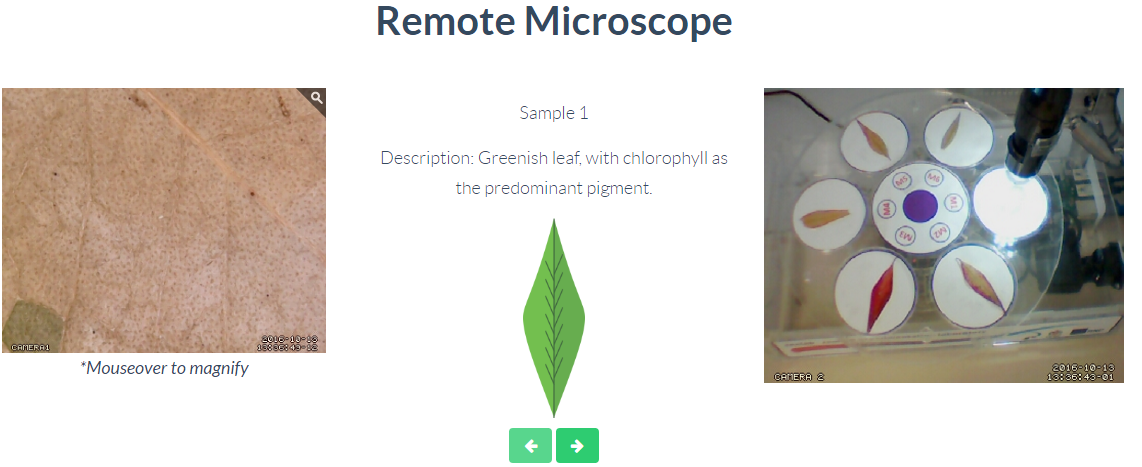
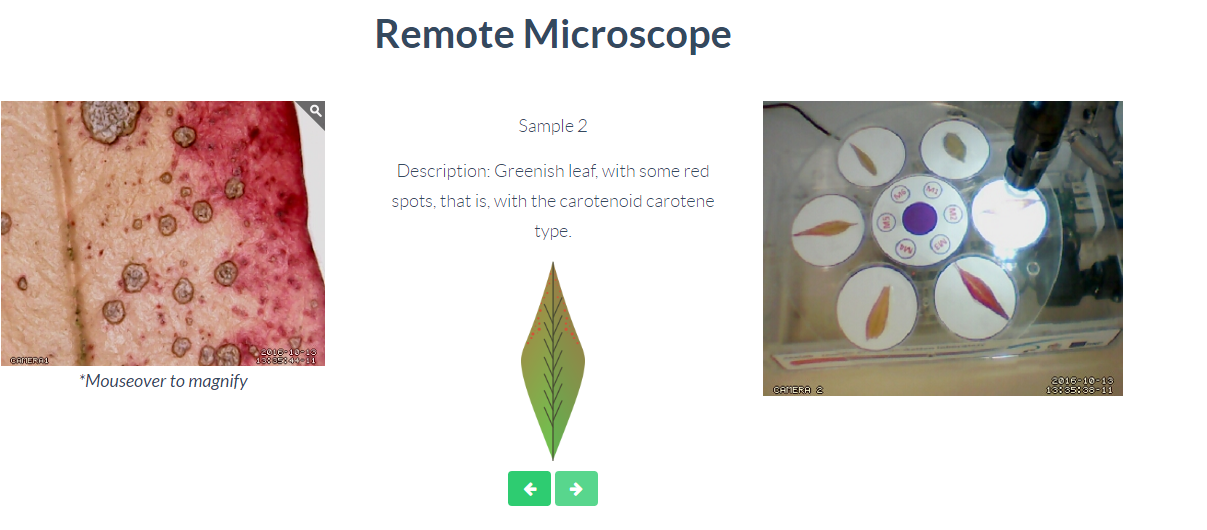
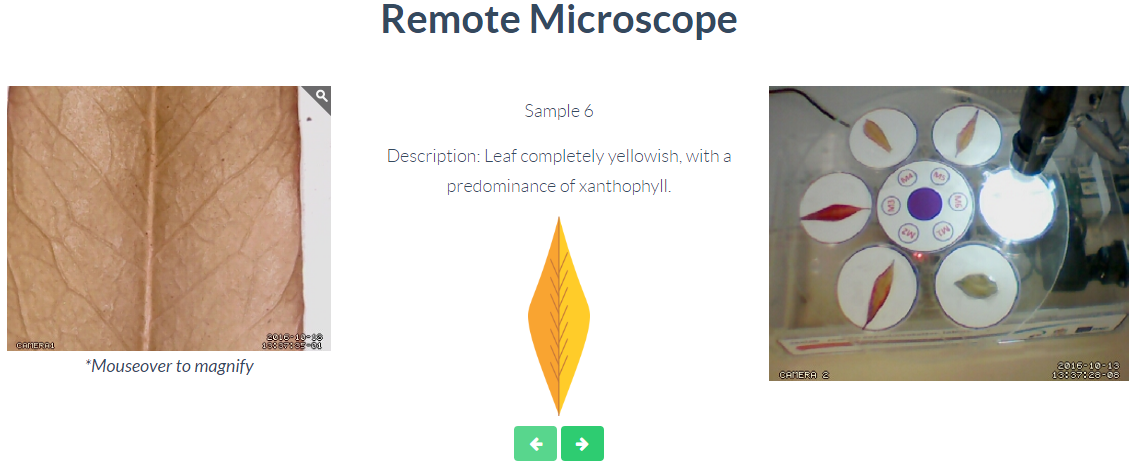
Tree Leaves
Through this remote laboratory you can control the samples under observation of a microscope. The available samples allow to analyze 6 different samples of leaves, comparing their different pigments and colorations
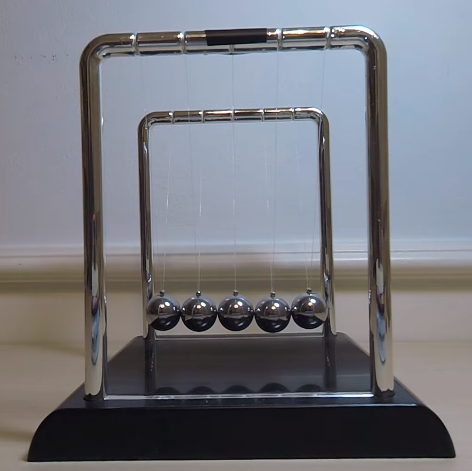
Newton's Cradle
Newton's cradle is a device that demonstrates conservation of momentum and energy using a series of swinging spheres.