Physics · Ages 15–16 · 55 min
“The heavier pendulum will swing faster.” “No, it depends on how long it is.” “If you release it from higher up, it takes longer.” These predictions can open a physics lesson with a question students can discuss before measuring: how would we organise a comparison to decide which explanation the evidence supports?
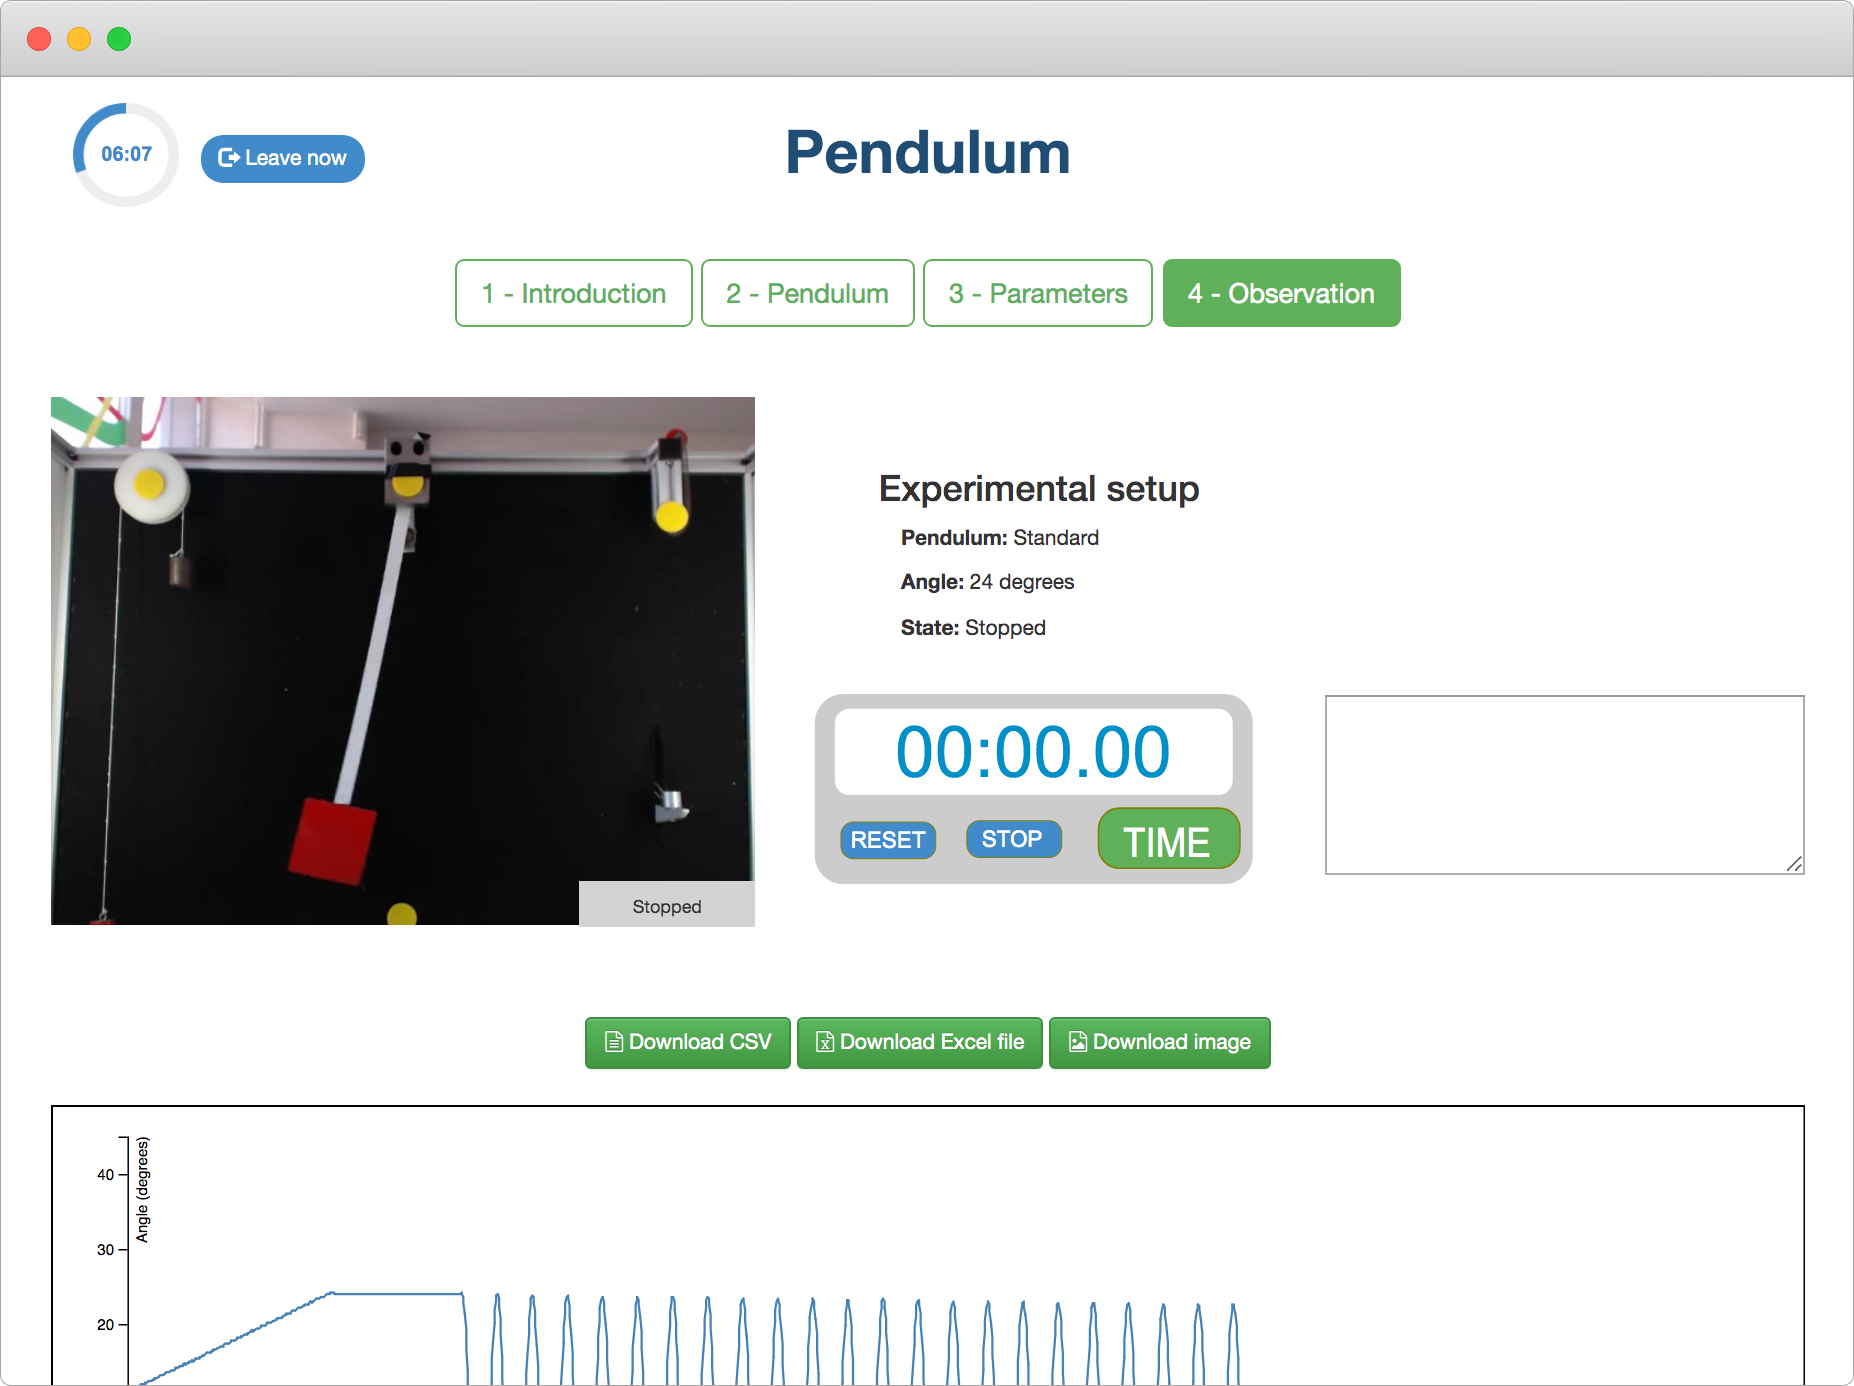
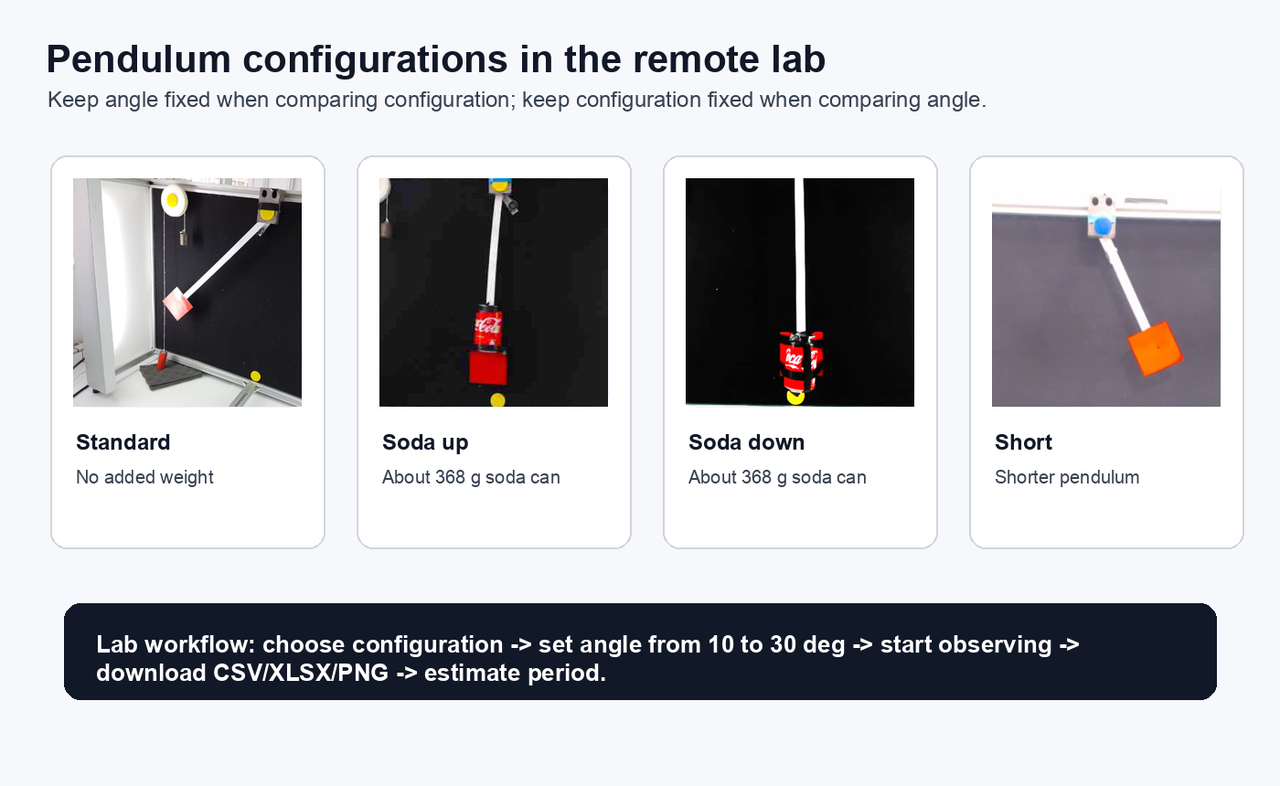
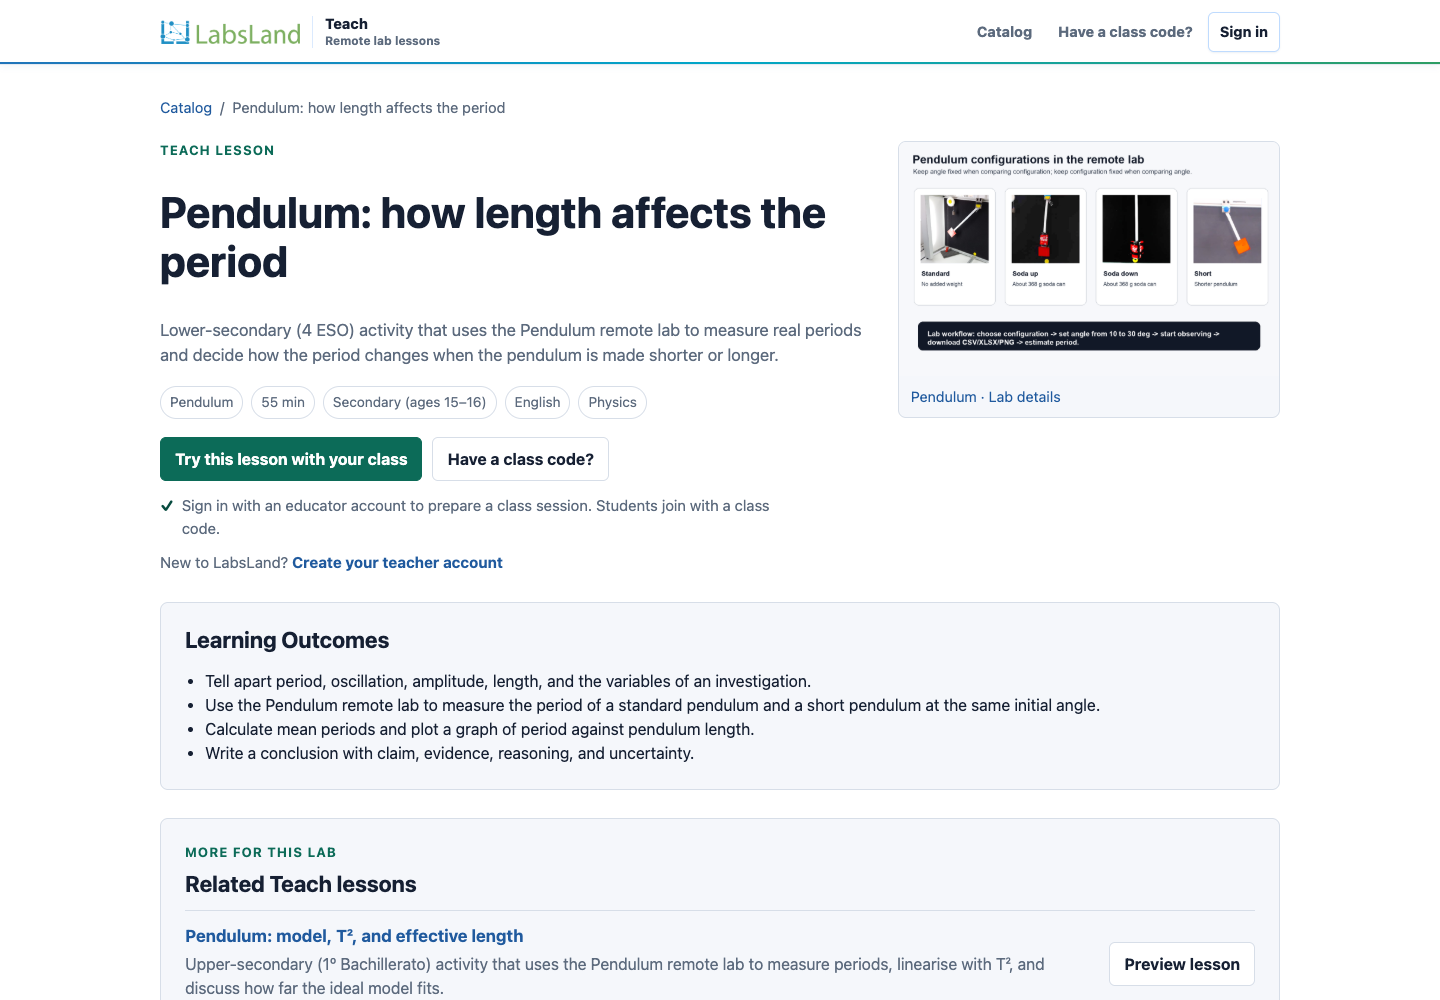
The Pendulum laboratory, from BIFI, lets students select configurations and observe recordings of real motion. For a first investigation in secondary school, narrow the question to comparing Standard and Short at the same initial angle. From that comparison, students can discuss what changes, how to measure the period, and how far their conclusion reaches.
From a broad question to a focused investigation
Write three possible causes on the board: length, initial angle and mass. Ask for an individual prediction before discussing them. Then ask: “If we change all three at once, will we know which one explains the result?” The answer sets up the central decision of the lesson: start with a controlled comparison.
Pendulum: how length affects the period is designed for students aged 15–16 and a lesson of about 55 minutes. It includes the procedure, tables, graphing and conclusion questions. You can use those materials and focus your support on reviewing experimental decisions and connecting different groups’ answers.
What to check before class
Open the laboratory using the access your students will use and check that Standard and Short at 15° are available. The public demo allows only Standard at 15°, so it is not enough for the full comparison. Also check that the video plays smoothly and that you can read the graph or stopwatch.
This is an ultraconcurrent laboratory: the observations come from real experiments recorded for the available configurations. Explain this when you introduce the activity. Students choose which recording to analyse and measure physical motion; they are not adjusting a pendulum live on the other side of the camera.
For this comparison, reading the graph or timing the video is enough. If you want to work with downloaded files, check that option beforehand using your class’s access.
How to organise the 55 minutes
Work in pairs or groups of three. Assign navigation, reading or counting, and recording; in a pair, one student combines two roles. Ask students to swap roles when they change configuration. If you collect individual submissions, allow each student time to explain their own calculation, even when the group shares observations.
- First 10 minutes: prediction and design. Collect initial ideas. Decide with the class what will be compared and what will stay the same: the 15° angle, measurement method and number of oscillations per reading.
- 15 minutes of observation. Groups work with Standard and Short. Before they collect more measurements, check one reading from each group to see whether they are counting half-oscillations.
- 14 minutes of recording and calculation. Each group completes its measurements and calculates the periods. Ask them to keep the time interval and number of oscillations; a result without a method will be difficult to review.
- 9 minutes of graphing. Compare mean periods and the spread of readings with the class. Use the labels Standard and Short if you do not have verified lengths in metres.
- 7 minutes for conclusions. Discuss two or three answers and return to the predictions. Each student explains which conclusion their measurements support and what they still cannot decide.
For a 45-minute class, you can reduce the work to two readings per configuration and simplify the graph. Keep the controlled comparison and final discussion: without them, the activity can become an exercise in writing down numbers.
A complete oscillation: the detail that changes the measurement
Rehearse the count with your hand before using the screen. Starting at one end, travelling to the other and returning to the starting point is one oscillation. On a graph, look for equivalent points: two consecutive maxima, or two crossings of the centre line in the same direction. Two consecutive crossings in opposite directions mark half an oscillation.
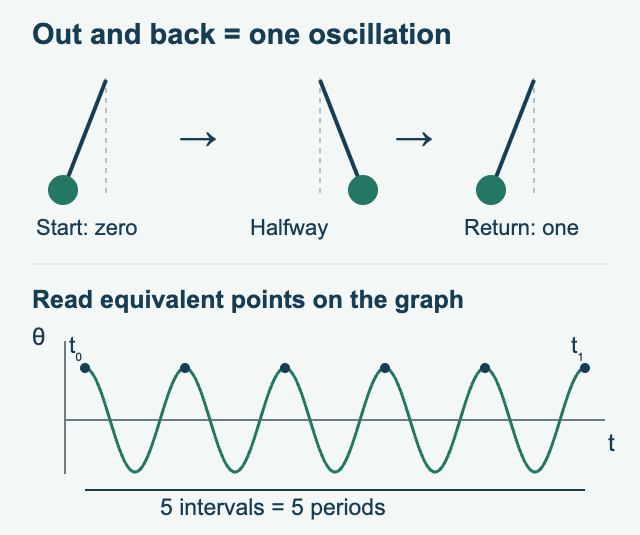
Reading several oscillations reduces the relative effect of a small error in choosing the start or end. Calculate T = (end time − start time) / number of complete oscillations. For example, if four oscillations take 6.0 seconds, the period is 1.5 seconds. This example explains the calculation; each group must use its own reading.
What to do when groups disagree
If one group gets a period roughly half that of another, ask them to show where they started and finished. For small differences, review the choice of points and reading resolution with both groups before deciding that the pendulums behave differently.
The range between the largest and smallest readings for one configuration gives an initial indication of spread. It is not a complete statistical uncertainty, but it helps students ask whether the difference between configurations is clearly larger than the variation in their method. Avoid asking for decimal places that the display or timing method cannot justify.
If playback is interrupted, discard that timing. If a configuration will not open, use backup data you collected during the pre-class check and label it as such. Students can analyse those data, but should state who collected them and not present them as their own measurements.
What about mass?
Return to the initial prediction. In the ideal simple pendulum model, for small oscillations, the period depends on length and gravity, not on the suspended mass. However, changing the position of a can changes the distribution of mass. Comparing those positions does not let students attribute the result solely to “being heavier”.
For a later lesson, Pendulum: what controls the period? compares angles and configurations. With students who already work with mathematical models, Pendulum: model, T², and effective length supports discussion of the ideal relationship and its limits. The distinction between simple and physical pendulums is also explained in OpenStax’s section on pendulums.
A conclusion worth discussing
Instead of “We have proved the pendulum law”, ask for a sentence beginning “In our observations…”. It should cite both mean periods, explain the method and acknowledge a limitation. Comparing two configurations can support a trend, but does not establish an exact relationship for every possible length.
Download the one-page class plan to keep the timings, questions and checks to hand. For students’ instructions and submissions, use the Teach activity and its instructor guide. The aim of the final discussion is for each student to explain why their comparison makes sense and how they would improve it.